Lesson 1
Welcome to Python and Ceteris LAB
Big question
How can one language carry an economic question from raw observations to a reproducible conclusion?
Lesson progress
Complete checkpoints as you learn
Learning objectives
- Explain why Python is useful in economics, finance, econometrics, and AI.
- Distinguish scripts, notebooks, packages, and environments.
- Run a small end-to-end analysis.
- Recognize the difference between computation and interpretation.
- Prerequisites: No programming experience is required.
- Key terms: Python, open source, notebook, script, package, reproducibility.
Simple explanation
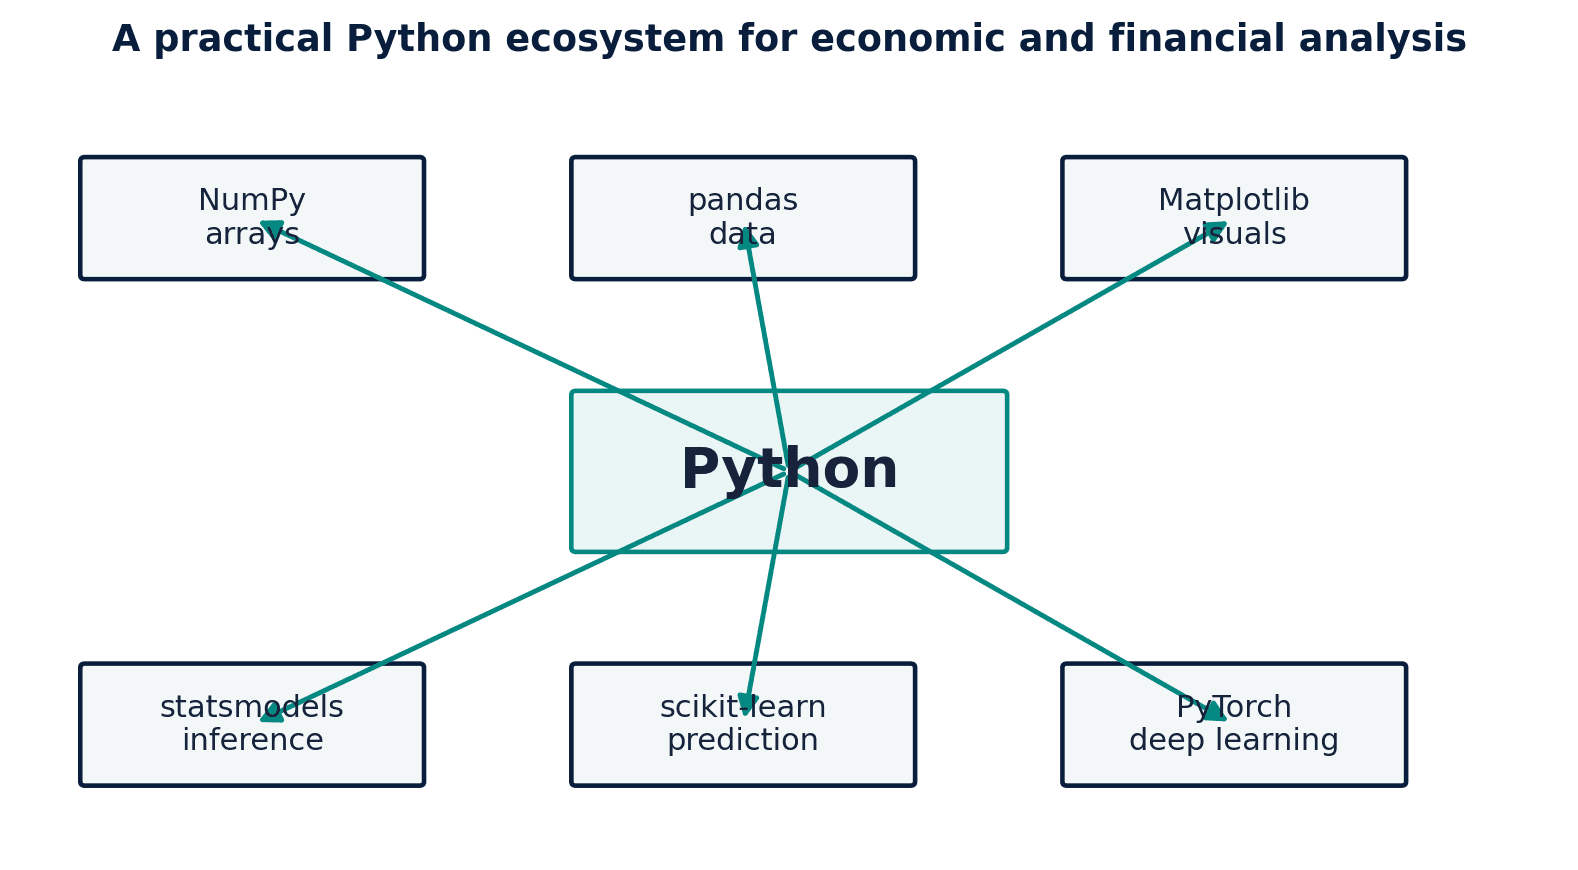
Python is both a general-purpose programming language and the centre of a large scientific ecosystem. The language supplies readable syntax, functions, objects, and modules. Libraries such as NumPy, pandas, Matplotlib, statsmodels, scikit-learn, and PyTorch add numerical computing, data management, visualization, econometrics, machine learning, and deep learning. The result is a connected workshop rather than a single-purpose calculator. A student can clean a Statistics Canada table, estimate a regression, visualize uncertainty, and document the workflow without changing languages. Current Python documentation remains the authority for syntax and standard-library behaviour (Python Software Foundation 2026).
Key terms
- why Python is useful in economics, finance, econometrics, and AI
- A core idea in Chapter 1 that students apply carefully in economic analysis.
- scripts, notebooks, packages, and environments
- A core idea in Chapter 1 that students apply carefully in economic analysis.
- Run a small end-to-end analysis
- A core idea in Chapter 1 that students apply carefully in economic analysis.
- Recognize the difference between computation and interpretation
- A core idea in Chapter 1 that students apply carefully in economic analysis.
- Prerequisites: No programming experience is required
- A core idea in Chapter 1 that students apply carefully in economic analysis.
- Key terms: Python, open source, notebook, script, package, reproducibility
- A core idea in Chapter 1 that students apply carefully in economic analysis.
Analytical workflow
Interpret the expression in words and units before using it in a claim.
Example
Interpretation. The mean summarizes the four observations, while the final rows preserve the temporal detail. A statistic and the underlying data answer different questions.
Prerequisites
- Complete the preceding course chapters or review their summaries as needed.
Full theory and examples
1.2
A language and an ecosystem
Python is both a general-purpose programming language and the centre of a large scientific ecosystem. The language supplies readable syntax, functions, objects, and modules. Libraries such as NumPy, pandas, Matplotlib, statsmodels, scikit-learn, and PyTorch add numerical computing, data management, visualization, econometrics, machine learning, and deep learning. The result is a connected workshop rather than a single-purpose calculator. A student can clean a Statistics Canada table, estimate a regression, visualize uncertainty, and document the workflow without changing languages. Current Python documentation remains the authority for syntax and standard-library behaviour (Python Software Foundation 2026).
1.3
From question to evidence
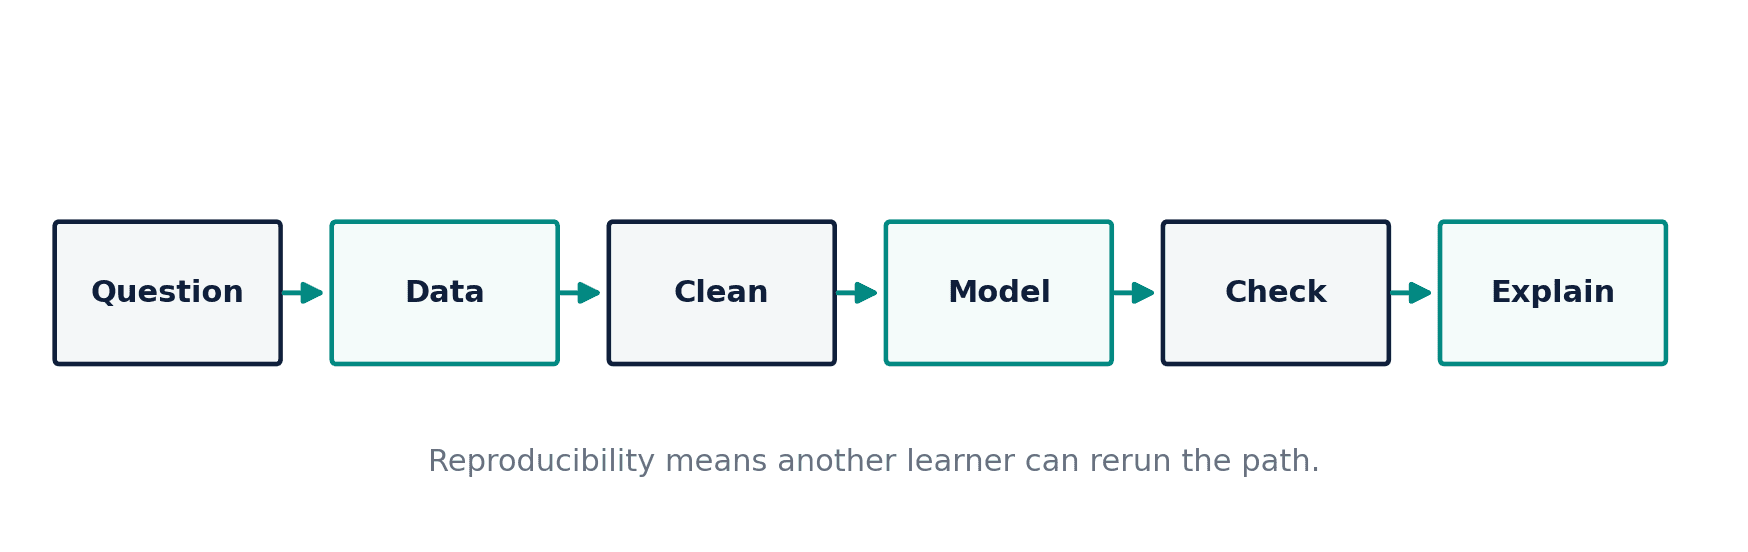
A useful analysis begins with a question, not with a package. The Ceteris LAB workflow used throughout this book is: define the question, identify data, validate inputs, transform variables, estimate or simulate, diagnose the result, communicate the evidence, and preserve enough metadata for another person to repeat the work. Reproducibility does not mean that every future run will be numerically identical. It means that the code, data provenance, assumptions, software versions, and random seeds are visible rather than hidden in a maze of clicks.
1.4
What Python cannot decide for you
Software can calculate quickly and still answer the wrong question. Python does not decide whether a variable measures the intended concept, whether a relationship is causal, whether a forecast is useful, or whether a financial result is suitable for a real decision. Those judgements remain analytical tasks. Throughout the book, each result is followed by interpretation and limitation. This separation is especially important when AI tools generate code: fluent syntax is not evidence that a model is correctly specified.
1.5
Python demonstrations
1.5.1
Demonstration 1.1: A first miniature analysis
Verified output
Interpretation. The mean summarizes the four observations, while the final rows preserve the temporal detail. A statistic and the underlying data answer different questions.
1.5.2
Demonstration 1.2: A named calculation
Verified output
Interpretation. Clear names make the calculation readable as a small model rather than a string of unexplained numbers.
1.6
Visual evidence
1.7
Reference table
Why This Matters
Python makes the complete chain of evidence visible. That visibility is the foundation of auditability, collaboration, and careful learning.
Common Mistake
Treating a successful run as proof that the analysis is correct. Code execution checks syntax and computation, not research design.
Ceteris LAB Tip
Before importing a package, write the question in one sentence and name the output that would answer it.
R-to-Python / Source Bridge
The opening financial time-series lecture emphasized obtaining, processing, and interpreting data. This chapter preserves that objective while replacing the 2013 R-first workflow with a modern Python-first path (Tsay 2013).
| Tool | Primary role | Typical classroom use |
|---|---|---|
| Python language | Logic and reusable instructions | Functions and simulations |
| Jupyter notebook | Narrative plus executable cells | Labs and demonstrations |
| Package | Specialized functionality | pandas, statsmodels, scikit-learn |
| Environment | Controlled package versions | Rebuilding the book |
Visual evidence
Additional Python demonstrations
Live Python
Source demonstration 2
Source demonstration 2
Stdout
Run Python to see results here.
Status / stderr
Ready to run Python in your browser.
Line-by-line guide
- Line 1Create or update a Python object used in the analysis.
- Line 2Create or update a Python object used in the analysis.
- Line 3Create or update a Python object used in the analysis.
- Line 4Create or update a Python object used in the analysis.
- Line 5Display a result so students can inspect the output.
Verified source output
2.7499999999999996
  month  rate
2   Mar   2.7
3   Apr   2.6
Future value: $1,141.17
2.7499999999999996 month rate 2 Mar 2.7 3 Apr 2.6
import pandas as pd
inflation = pd.DataFrame({
print(inflation["rate"].mean())
print(inflation.tail(2))
future_value = principal * (1 + annual_rate) ** years
print(f"Future value: ${future_value:,.2f}")
Interpretation. The mean summarizes the four observations, while the final rows preserve the temporal detail. A statistic and the underlying data answer different questions.
Interpretation. Clear names make the calculation readable as a small model rather than a string of unexplained numbers.
Guided practice
- 1Re-run Demonstration 1.1 and change one input while keeping the analytical question fixed.
- 2Explain in two sentences how the output supports, or fails to support, the chapter opening question.
- 3Add one validation check that would prevent a plausible error.
Exercises
- 1Change the four inflation rates and recompute the mean.
- 2Add a fifth month and calculate the minimum and maximum.
- 3Write one sentence explaining why the mean alone may hide important variation.
- 4Create a compound-growth example using your own values.
Source and downloads
Chapter 1 of Fundamentals of Python for Financial Econometrics by Mohammad Safavi, Ph.D.. The lesson is an original Ceteris Lab web adaptation of the supplied publication package.
Live Python
Welcome to Python and Ceteris LAB: live Python
Welcome to Python and Ceteris LAB: live Python
Stdout
Run Python to see results here.
Status / stderr
Ready to run Python in your browser.
Line-by-line guide
- Line 1Load a Python library needed for data work or regression.
- Line 3Create or update a Python object used in the analysis.
- Line 4Run this Python instruction as part of the lesson workflow.
- Line 5Run this Python instruction as part of the lesson workflow.
- Line 6Run this Python instruction as part of the lesson workflow.
- Line 7Display a result so students can inspect the output.
- Line 8Display a result so students can inspect the output.
Python walkthrough
- 1`import pandas as pd`: Loads a package or function used by the analysis.
- 2`inflation = pd.DataFrame({`: Creates or updates a named object used by later steps.
- 3`"month": ["Jan", "Feb", "Mar", "Apr"],`: Executes the next transparent step in the workflow.
- 4`"rate": [2.9, 2.8, 2.7, 2.6],`: Executes the next transparent step in the workflow.
- 5`})`: Executes the next transparent step in the workflow.
- 6`print(inflation["rate"].mean())`: Displays a result so it can be checked and interpreted.
- 7`print(inflation.tail(2))`: Displays a result so it can be checked and interpreted.
Live notebook
Run this lesson as a notebook
Open an editable notebook cell-by-cell, run Python in the browser, and download the `.ipynb` file for later.
Related dataset
Ceteris Lab teaching sample
Estimated time
25 to 40 min
Packages
pandas, numpy
Expected output
Printed Python results that can be compared with the lesson explanation.
Learning goals
- Load and inspect Ceteris Lab teaching sample.
- Run the Python cells connected to Welcome to Python and Ceteris LAB.
- Interpret the output using why Python is useful in economics, finance, econometrics, and AI and scripts, notebooks, packages, and environments.
Common errors
- File not found: check that wage_sample.csv is installed or use the course data folder.
- Package import error: use the browser notebook first, then download for local Jupyter if your local packages differ.
- Column name error: compare your variable names with the dataset variables listed for this notebook.
Dataset path helper
import pandas as pd

df = pd.read_csv("/data/wage_sample.csv")
df.head()
Interactive activity
Chapter 1 interactive
Reproducible Python decision lab
Which step should come before trusting a successful Python run?
Immediate feedback
Choose a decision, then test how the claim changes as evidence becomes stronger or weaker.
Try it yourself
Write one plain-English sentence explaining the main idea from this lesson.
Common mistakes
Check these before you move on.
Return to the lesson assumptions, units, diagnostics, and source evidence to replace this shortcut with a defensible interpretation.
Quick quiz
Which statement best answers the Chapter 1 opening question: How can one language carry an economic question from raw observations to a reproducible conclusion?
Quick quiz
Which practice should be avoided when applying Welcome to Python and Ceteris LAB?
Quick quiz
What is the most defensible way to interpret the Python demonstration?
Quick quiz
Why does Chapter 1 matter in an applied econometrics workflow?
Key takeaway
Python combines a readable language with specialized scientific libraries. A reproducible workflow connects question, data, computation, interpretation, and documentation. Analytical judgement cannot be delegated to software.