Lesson 47
Machine-Learning Workflow and Gradient Descent for Economic Data
Big question
How can a model be trained without letting information from the future or test set leak into the learning process?
Lesson progress
Complete checkpoints as you learn
Learning objectives
- Define features, labels, train, validation, and test sets.
- Recognize overfitting, underfitting, and leakage.
- Explain loss functions and gradient descent.
- Build reproducible preprocessing pipelines.
- Prerequisites: Chapter 27 and basic calculus intuition.
- Key terms: feature, label, generalization, data leakage, loss function, gradient descent.
Simple explanation
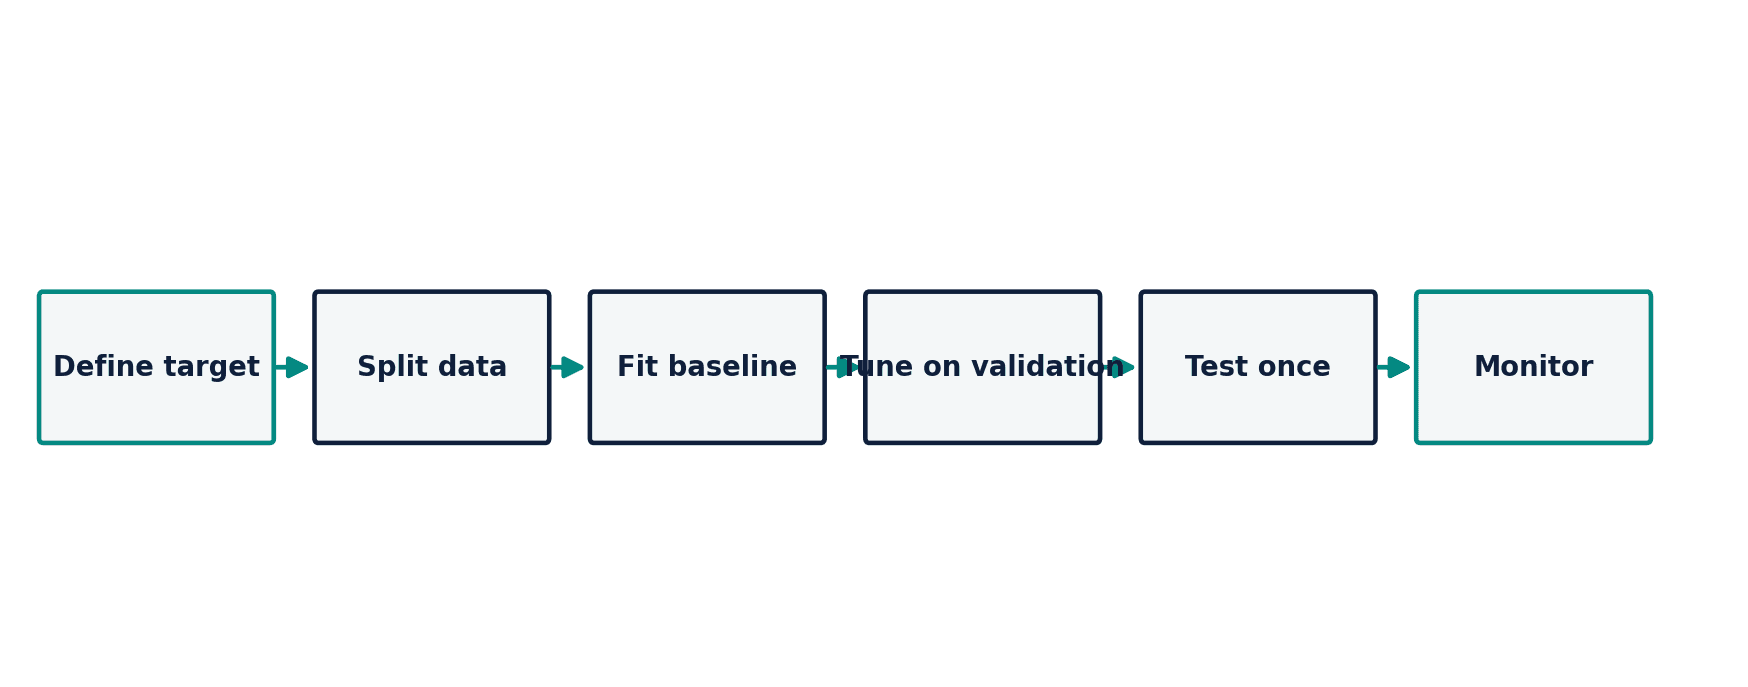
A training set estimates model parameters. A validation set supports choices such as complexity and tuning. A test set is held back for the final unbiased evaluation of the chosen workflow. In time series, random splitting can let future observations train a model used to “predict” the past. The split must reflect deployment: future-from-past forecasting, new households, new countries, or new images.
Key terms
- Define features, labels, train, validation, and test sets
- A core idea in Chapter 47 that students apply carefully in economic analysis.
- Recognize overfitting, underfitting, and leakage
- A core idea in Chapter 47 that students apply carefully in economic analysis.
- loss functions and gradient descent
- A core idea in Chapter 47 that students apply carefully in economic analysis.
- Build reproducible preprocessing pipelines
- A core idea in Chapter 47 that students apply carefully in economic analysis.
- Prerequisites: Chapter 27 and basic calculus intuition
- A core idea in Chapter 47 that students apply carefully in economic analysis.
- Key terms: feature, label, generalization, data leakage, loss function, gradient descent
- A core idea in Chapter 47 that students apply carefully in economic analysis.
Analytical workflow
Interpret the expression in words and units before using it in a claim.
Example
Interpretation. The iterative slope converges to the least-squares solution for this noiseless one-parameter problem.
Prerequisites
- Complete the preceding course chapters or review their summaries as needed.
Full theory and examples
47.2
The split defines the claim
A training set estimates model parameters. A validation set supports choices such as complexity and tuning. A test set is held back for the final unbiased evaluation of the chosen workflow. In time series, random splitting can let future observations train a model used to “predict” the past. The split must reflect deployment: future-from-past forecasting, new households, new countries, or new images.
47.3
Overfitting is a gap between memory and generalization
A highly flexible model can fit training noise and fail on new observations. Underfitting occurs when a model is too constrained to capture relevant structure. Learning curves compare training and validation performance across sample sizes or complexity. Regularization, simpler features, more representative data, and better validation can reduce overfitting, but no method rescues a mismatch between training data and deployment conditions.
47.4
Gradient descent follows local slope information
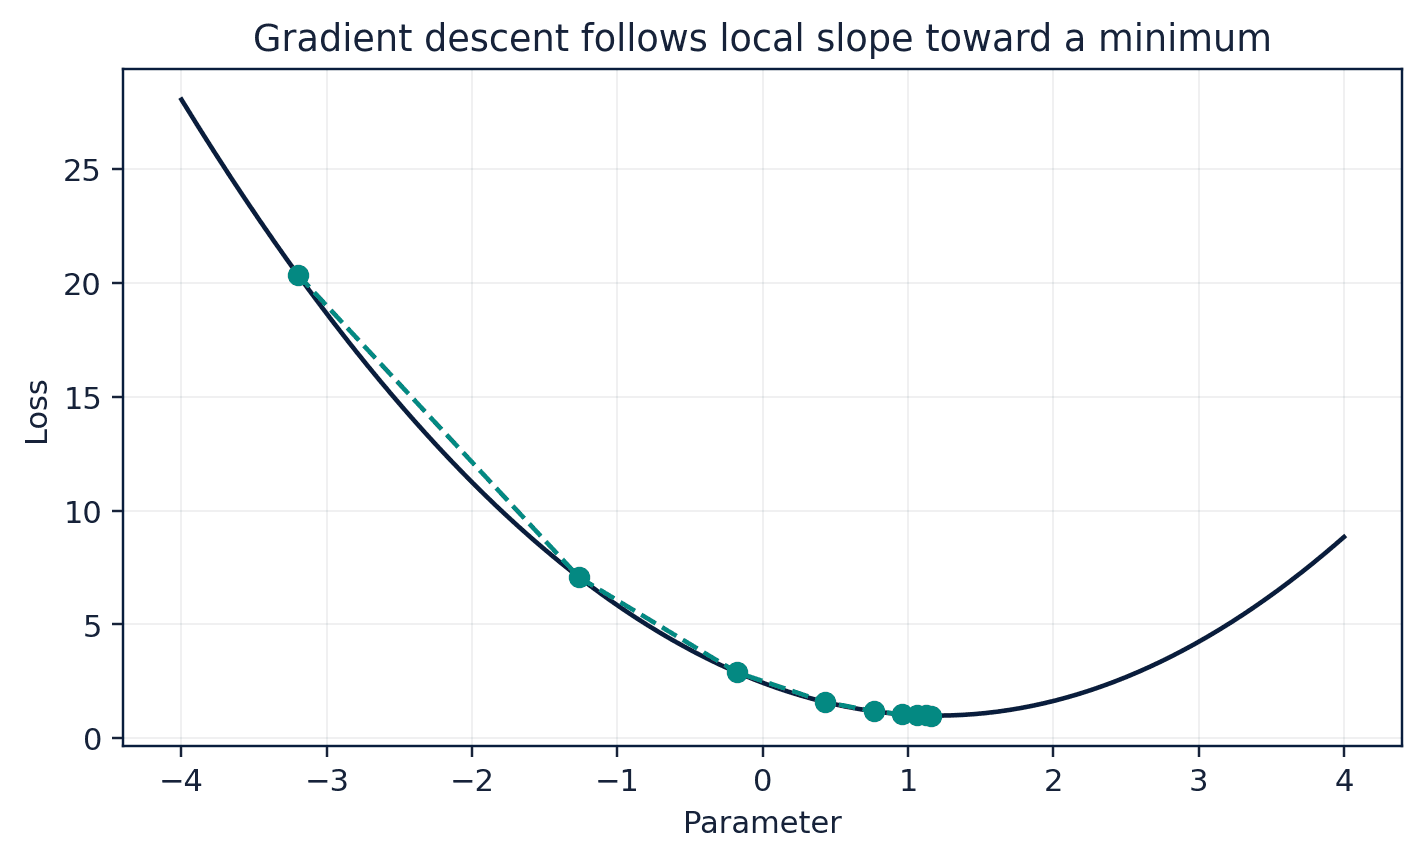
Gradient descent updates parameters in the direction that reduces a differentiable loss. The learning rate controls step size: too small can be slow, too large can oscillate or diverge. Feature scaling often improves numerical behaviour. Modern optimizers add momentum or adaptive scaling, yet the underlying idea remains iterative improvement of an objective. Optimization success does not guarantee a meaningful target or fair data.
47.5
Core equations
Gradient update
The learning rate eta scales a step opposite the loss gradient.
47.6
Python demonstrations
47.6.1
Demonstration 28.1: Gradient descent for one slope
Verified output
Interpretation. The iterative slope converges to the least-squares solution for this noiseless one-parameter problem.
47.6.2
Demonstration 28.2: A leakage-safe pipeline
Verified output
Interpretation. When the pipeline is fitted inside cross-validation, scaling parameters are learned only from each training fold.
47.7
Visual evidence
47.8
Reference table
Why This Matters
The evaluation design is part of the model. A score without a credible split says little about real-world generalization.
Common Mistake
Scaling the full dataset before cross-validation. Information from validation folds then influences training transformations.
Ceteris LAB Tip
Place every learned preprocessing step inside a pipeline.
R-to-Python / Source Bridge
The chapter adapts IntroAI sessions on features, labels, memorization, data leakage, MAE/MSE, gradient descent, and learning rates while adding econometric time-order controls (Sharifi-Zarchi and contributors 2026).
| Failure | How it appears | Prevention |
|---|---|---|
| overfitting | low train error, high validation error | simplify, regularize, improve validation |
| underfitting | high error on both | richer model or features |
| target leakage | implausibly strong validation | construct features using only available information |
| distribution shift | performance decays in deployment | representative data and monitoring |
| test-set tuning | test score improves after repeated choices | lock test set until final workflow |
Visual evidence
Additional Python demonstrations
Live Python
Source demonstration 2
Source demonstration 2
Stdout
Run Python to see results here.
Status / stderr
Ready to run Python in your browser.
Line-by-line guide
- Line 1Load a Python library needed for data work or regression.
- Line 2Load a Python library needed for data work or regression.
- Line 3Load a Python library needed for data work or regression.
- Line 5Create or update a Python object used in the analysis.
- Line 6Run this Python instruction as part of the lesson workflow.
- Line 7Create or update a Python object used in the analysis.
- Line 8Run this Python instruction as part of the lesson workflow.
- Line 9Display a result so students can inspect the output.
Verified source output
2.5
['scale', 'model']
Interpretation. The iterative slope converges to the least-squares solution for this noiseless one-parameter problem.
Interpretation. When the pipeline is fitted inside cross-validation, scaling parameters are learned only from each training fold.
Guided practice
- 1Re-run Demonstration 28.1 and change one input while keeping the analytical question fixed.
- 2Explain in two sentences how the output supports, or fails to support, the chapter opening question.
- 3Add one validation check that would prevent a plausible error.
Exercises
- 1Design train, validation, and test splits for a household dataset.
- 2Explain why random splitting is inappropriate for one-step-ahead forecasting.
- 3Experiment with three learning rates.
- 4Build a pipeline with imputation, scaling, and regression.
Source and downloads
Chapter 47 of Fundamentals of Python for Financial Econometrics by Mohammad Safavi, Ph.D.. The lesson is an original Ceteris Lab web adaptation of the supplied publication package.
Live Python
Machine-Learning Workflow and Gradient Descent for Economic Data: live Python
Machine-Learning Workflow and Gradient Descent for Economic Data: live Python
Stdout
Run Python to see results here.
Status / stderr
Ready to run Python in your browser.
Line-by-line guide
- Line 1Load a Python library needed for data work or regression.
- Line 3Create or update a Python object used in the analysis.
- Line 4Create or update a Python object used in the analysis.
- Line 5Create or update a Python object used in the analysis.
- Line 6Create or update a Python object used in the analysis.
- Line 7Run this Python instruction as part of the lesson workflow.
- Line 8Create or update a Python object used in the analysis.
- Line 9Create or update a Python object used in the analysis.
- Line 10Display a result so students can inspect the output.
Python walkthrough
- 1`import numpy as np`: Loads a package or function used by the analysis.
- 2`x = np.array([1., 2., 3., 4.])`: Creates or updates a named object used by later steps.
- 3`y = 2.5 * x`: Creates or updates a named object used by later steps.
- 4`slope = 0.0`: Creates or updates a named object used by later steps.
- 5`learning_rate = 0.02`: Creates or updates a named object used by later steps.
- 6`for _ in range(500):`: Repeats the indented calculation across observations or simulation draws.
- 7`gradient = -2 * np.mean(x * (y - slope*x))`: Creates or updates a named object used by later steps.
- 8`slope -= learning_rate * gradient`: Creates or updates a named object used by later steps.
- 9`print(round(slope, 4))`: Displays a result so it can be checked and interpreted.
Live notebook
Run this lesson as a notebook
Open an editable notebook cell-by-cell, run Python in the browser, and download the `.ipynb` file for later.
Related dataset
Ceteris Lab teaching sample
Estimated time
25 to 40 min
Packages
pandas, numpy
Expected output
Printed Python results that can be compared with the lesson explanation.
Learning goals
- Load and inspect Ceteris Lab teaching sample.
- Run the Python cells connected to Machine-Learning Workflow and Gradient Descent for Economic Data.
- Interpret the output using Define features, labels, train, validation, and test sets and Recognize overfitting, underfitting, and leakage.
Common errors
- File not found: check that wage_sample.csv is installed or use the course data folder.
- Package import error: use the browser notebook first, then download for local Jupyter if your local packages differ.
- Column name error: compare your variable names with the dataset variables listed for this notebook.
Dataset path helper
import pandas as pd

df = pd.read_csv("/data/wage_sample.csv")
df.head()
Interactive activity
Chapter 47 interactive
Model governance check
What is the safest basis for evaluating an ML or AI result?
Immediate feedback
Choose a decision, then test how the claim changes as evidence becomes stronger or weaker.
Try it yourself
Write one plain-English sentence explaining the main idea from this lesson.
Common mistakes
Check these before you move on.
Return to the lesson assumptions, units, diagnostics, and source evidence to replace this shortcut with a defensible interpretation.
Quick quiz
Which statement best answers the Chapter 47 opening question: How can a model be trained without letting information from the future or test set leak into the learning process?
Quick quiz
Which practice should be avoided when applying Machine-Learning Workflow and Gradient Descent for Economic Data?
Quick quiz
What is the most defensible way to interpret the Python demonstration?
Quick quiz
Why does Chapter 47 matter in an applied econometrics workflow?
Key takeaway
Generalization is measured on data not used for fitting or tuning. Leakage can make a weak model appear excellent. Gradient descent iteratively reduces a chosen loss.