Lesson 48
Applied Economic Prediction and Classification Projects
Big question
How can an end-to-end workflow turn housing and passenger data into models that are evaluated honestly and interpreted carefully?
Lesson progress
Complete checkpoints as you learn
Learning objectives
- Build a regression workflow with the Tehran housing data.
- Build a classification workflow with Titanic data.
- Use pipelines, cross-validation, and multiple metrics.
- Analyze residuals, confusion matrices, and subgroup performance.
- Prerequisites: Chapters 10, 15, and 28.
- Key terms: feature engineering, baseline, decision tree, confusion matrix, precision, recall.
Simple explanation
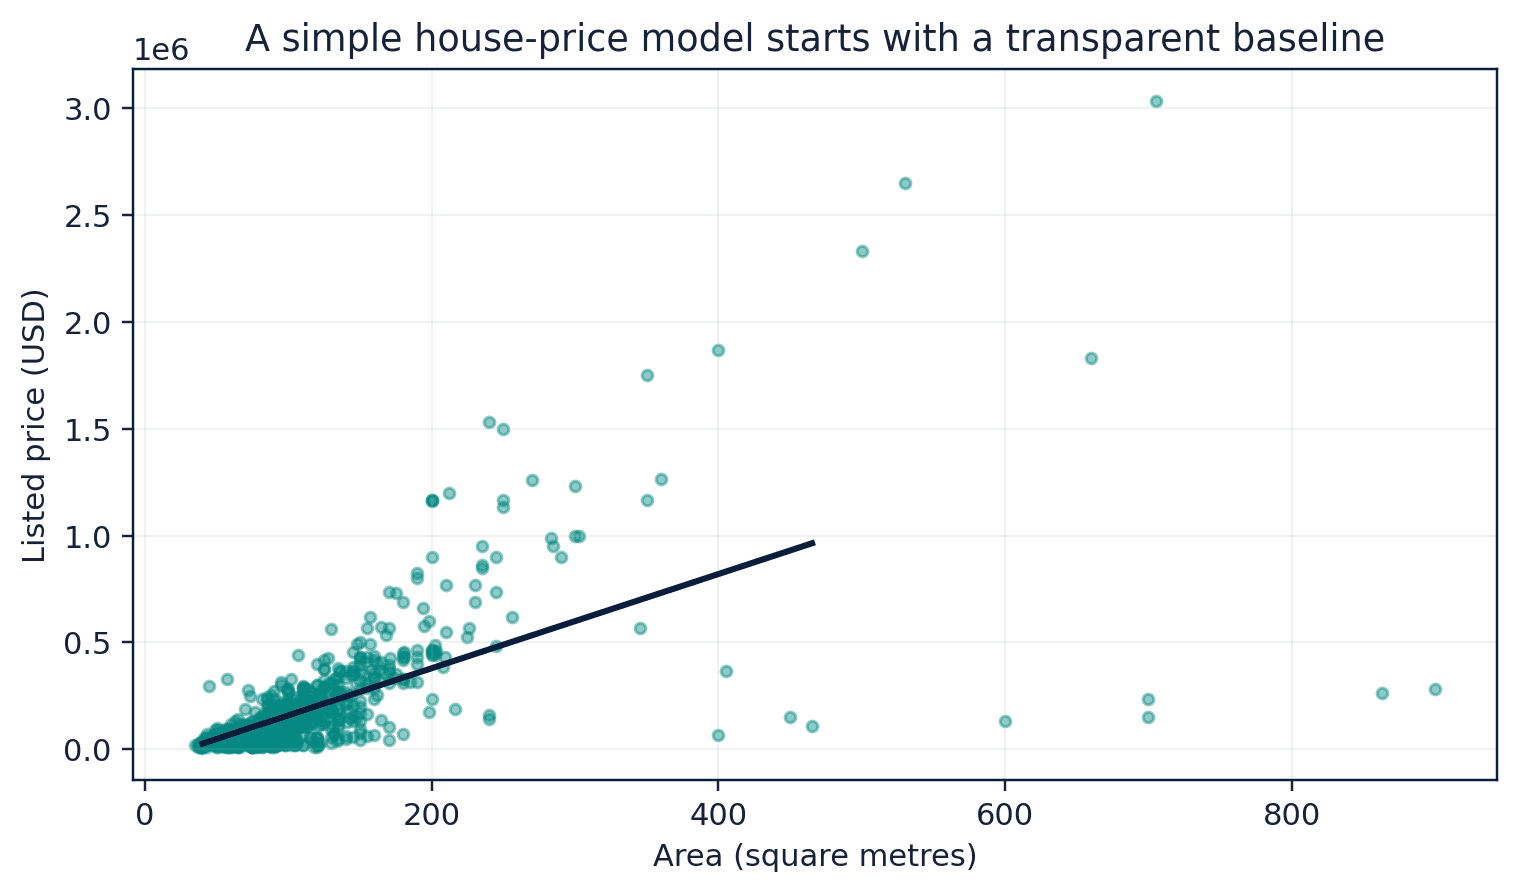
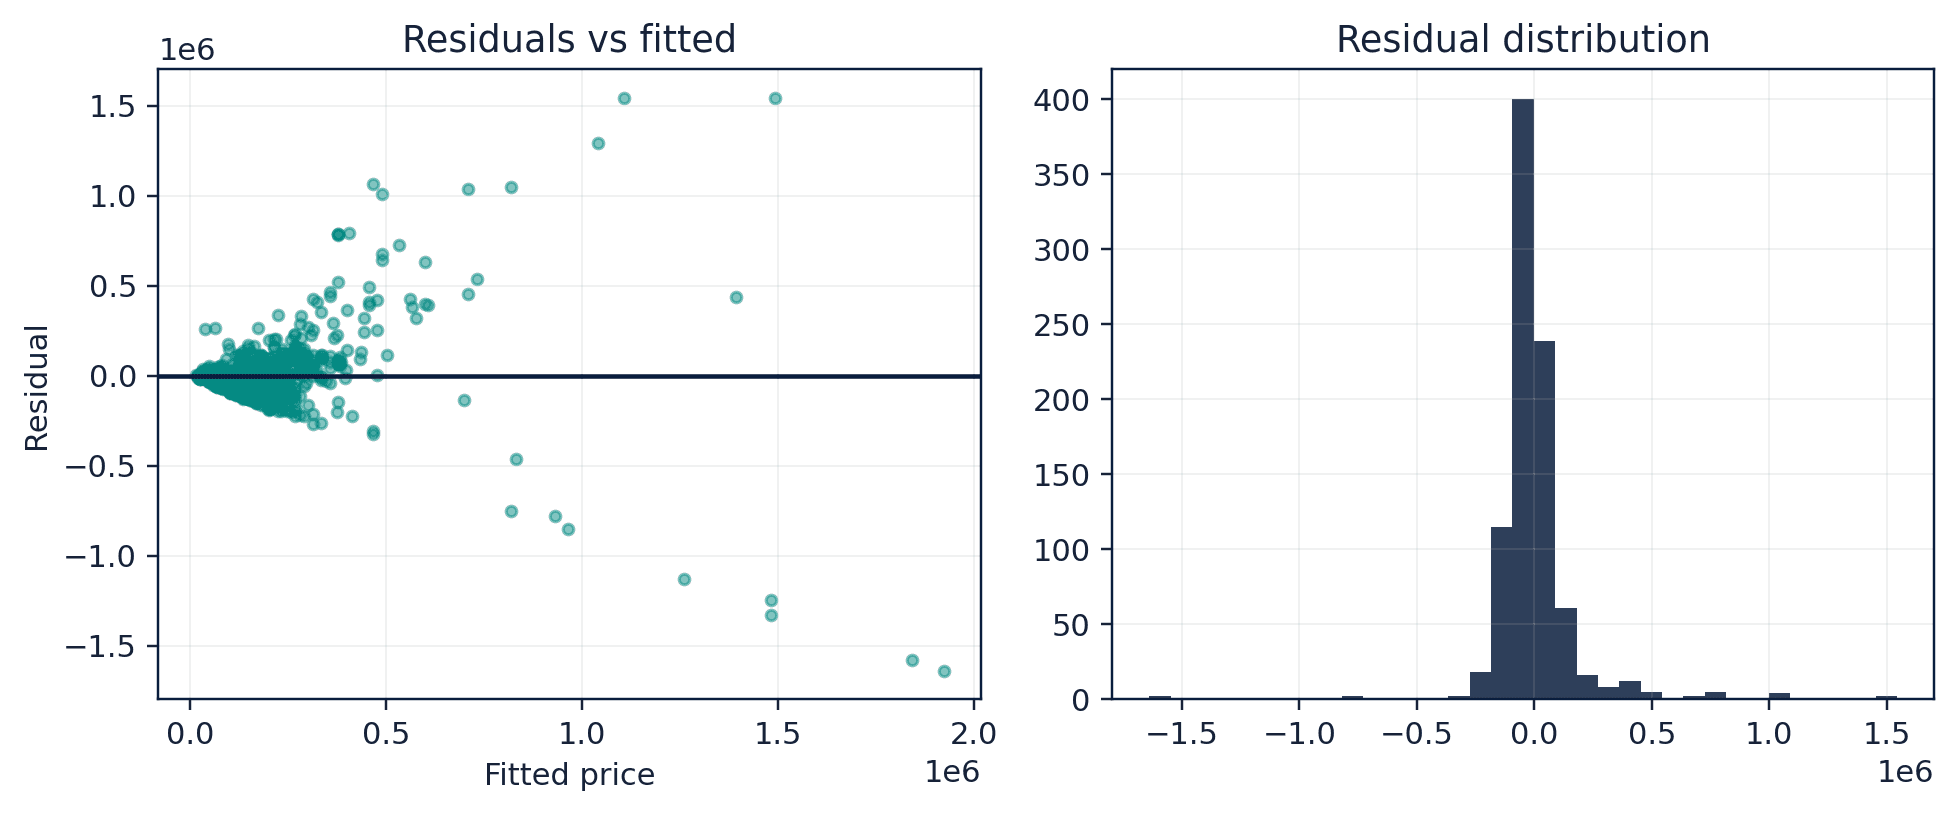
The housing dataset from the IntroAI archive supports a beginner regression project. The target is price, while area, rooms, parking, warehouse, elevator, and location-related variables serve as features. The workflow begins with a data audit and a simple baseline, then compares linear and tree-based models. Price distributions and neighbourhood effects can be highly skewed, so residual plots and transformed targets deserve attention. The exercise is predictive and does not estimate a causal effect of area or amenities.
Key terms
- Build a regression workflow with the Tehran housing data
- A core idea in Chapter 48 that students apply carefully in economic analysis.
- Build a classification workflow with Titanic data
- A core idea in Chapter 48 that students apply carefully in economic analysis.
- pipelines, cross-validation, and multiple metrics
- A core idea in Chapter 48 that students apply carefully in economic analysis.
- Analyze residuals, confusion matrices, and subgroup performance
- A core idea in Chapter 48 that students apply carefully in economic analysis.
- Prerequisites: Chapters 10, 15, and 28
- A core idea in Chapter 48 that students apply carefully in economic analysis.
- Key terms: feature engineering, baseline, decision tree, confusion matrix, precision, recall
- A core idea in Chapter 48 that students apply carefully in economic analysis.
Analytical workflow
Interpret the expression in words and units before using it in a claim.
Example
Interpretation. The slope is a predictive association in the dataset’s currency units per square metre, not a causal valuation rule.
Prerequisites
- Complete the preceding course chapters or review their summaries as needed.
Full theory and examples
48.2
Project A: Tehran house prices
The housing dataset from the IntroAI archive supports a beginner regression project. The target is price, while area, rooms, parking, warehouse, elevator, and location-related variables serve as features. The workflow begins with a data audit and a simple baseline, then compares linear and tree-based models. Price distributions and neighbourhood effects can be highly skewed, so residual plots and transformed targets deserve attention. The exercise is predictive and does not estimate a causal effect of area or amenities.
48.3
Project B: Titanic classification
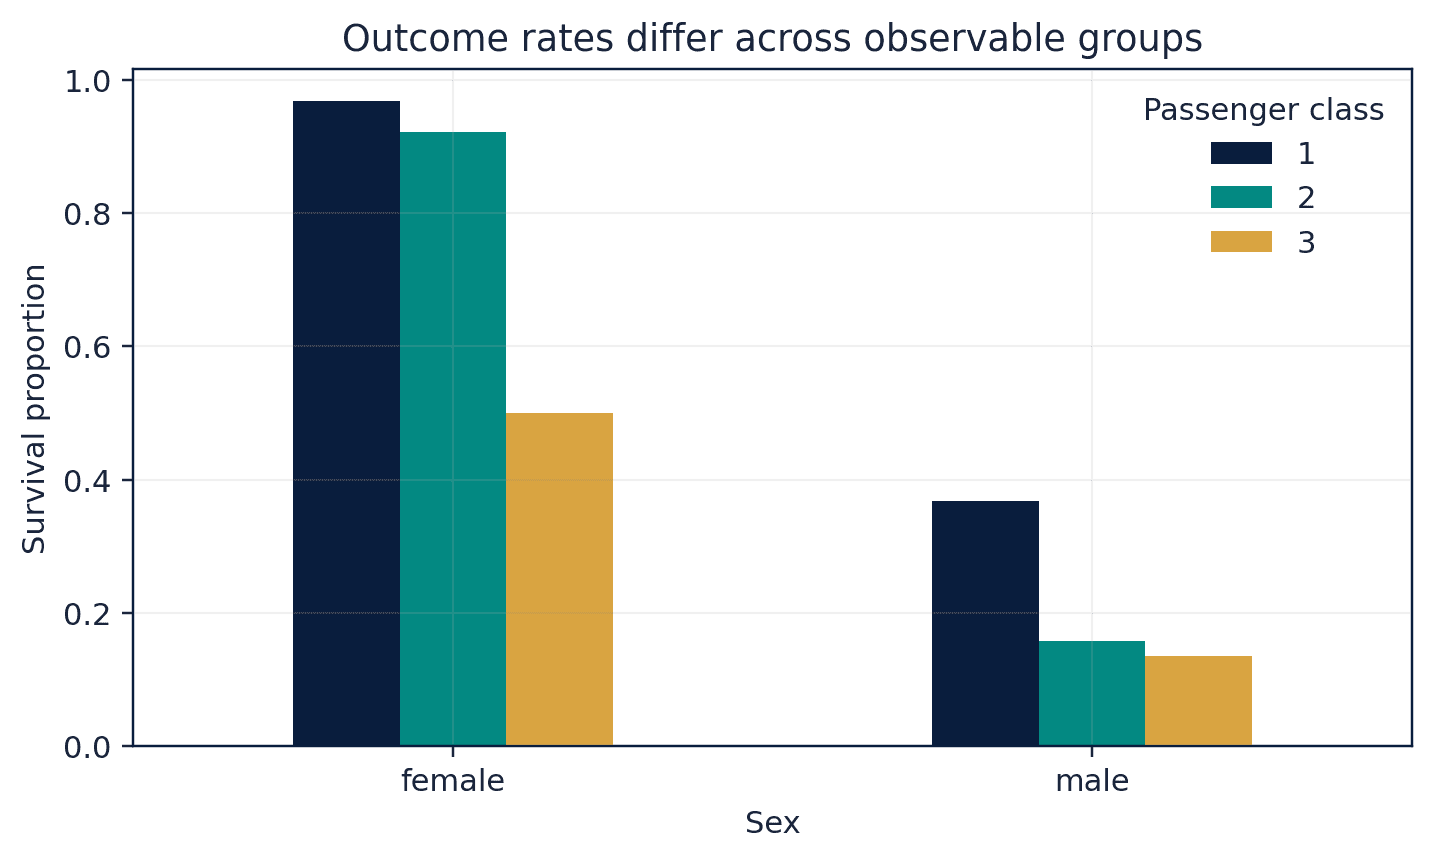
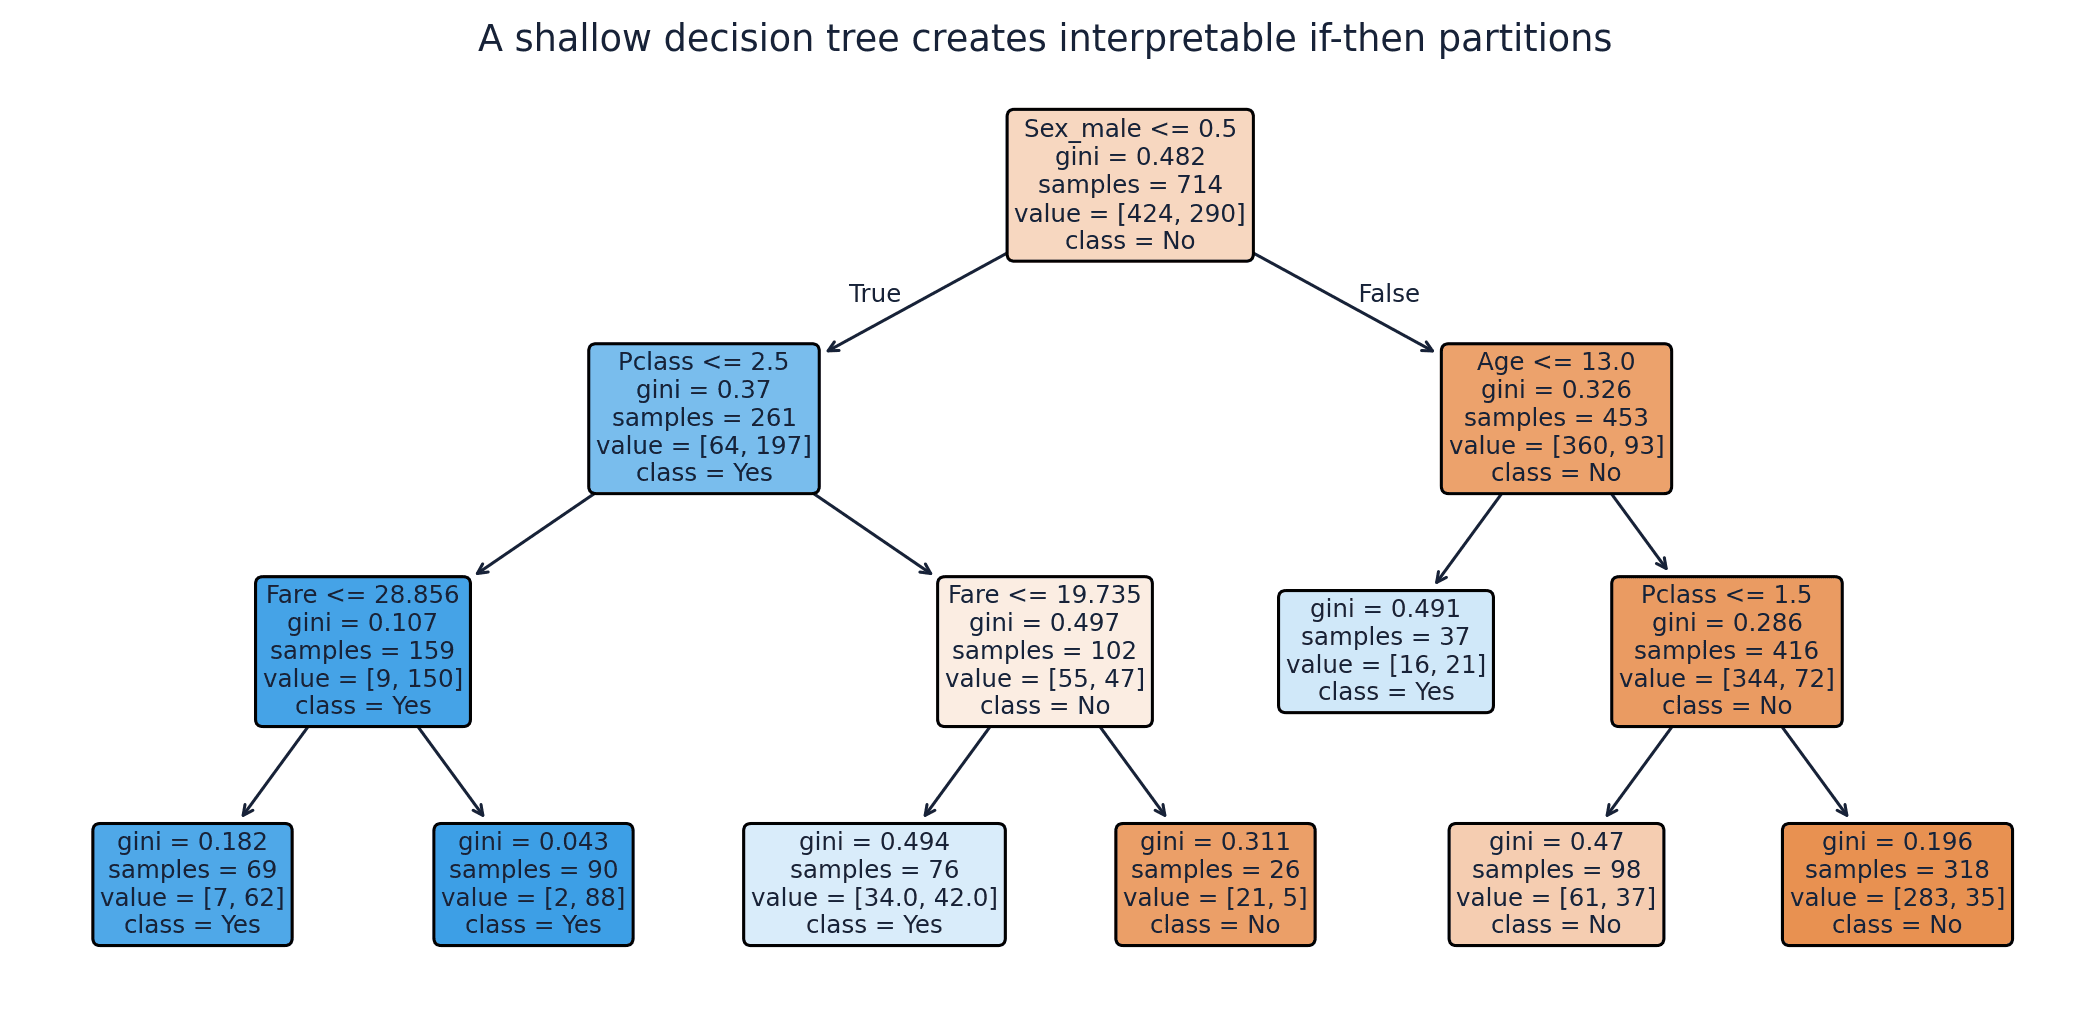
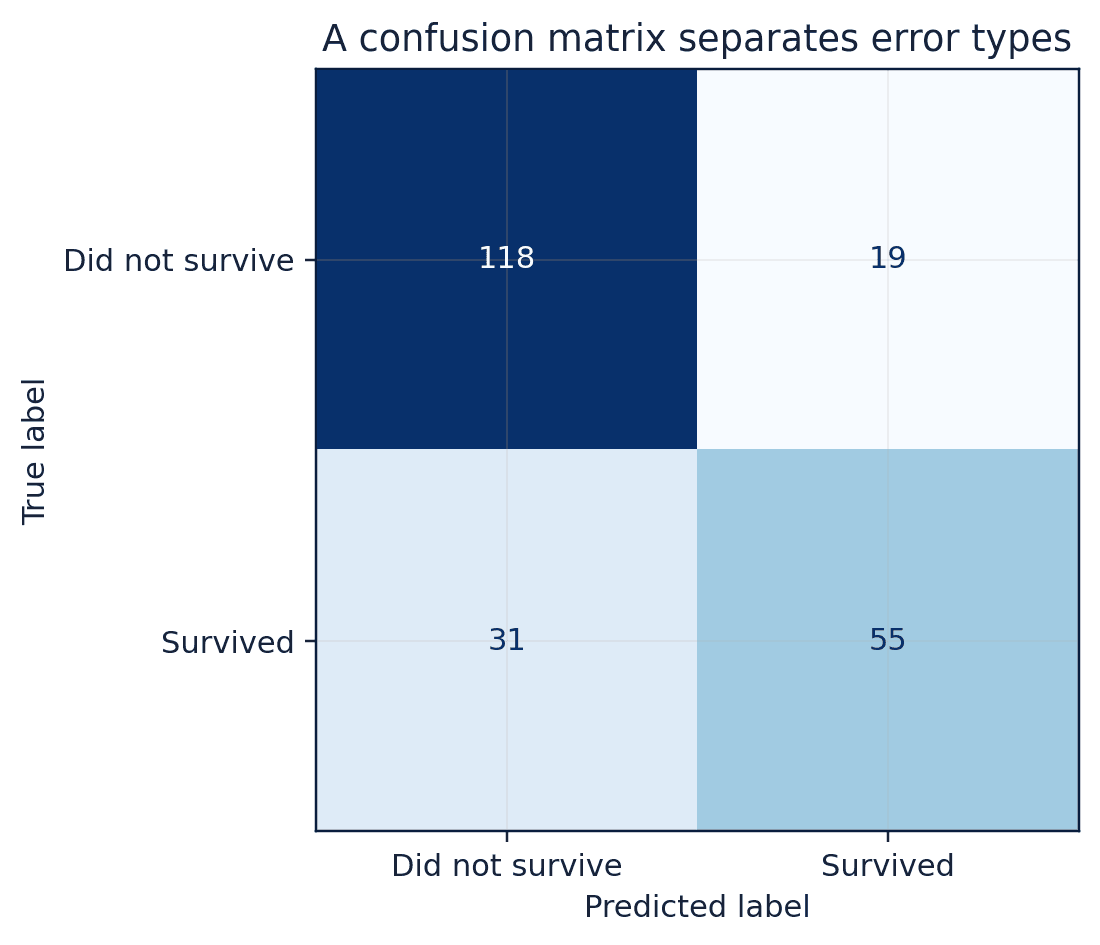
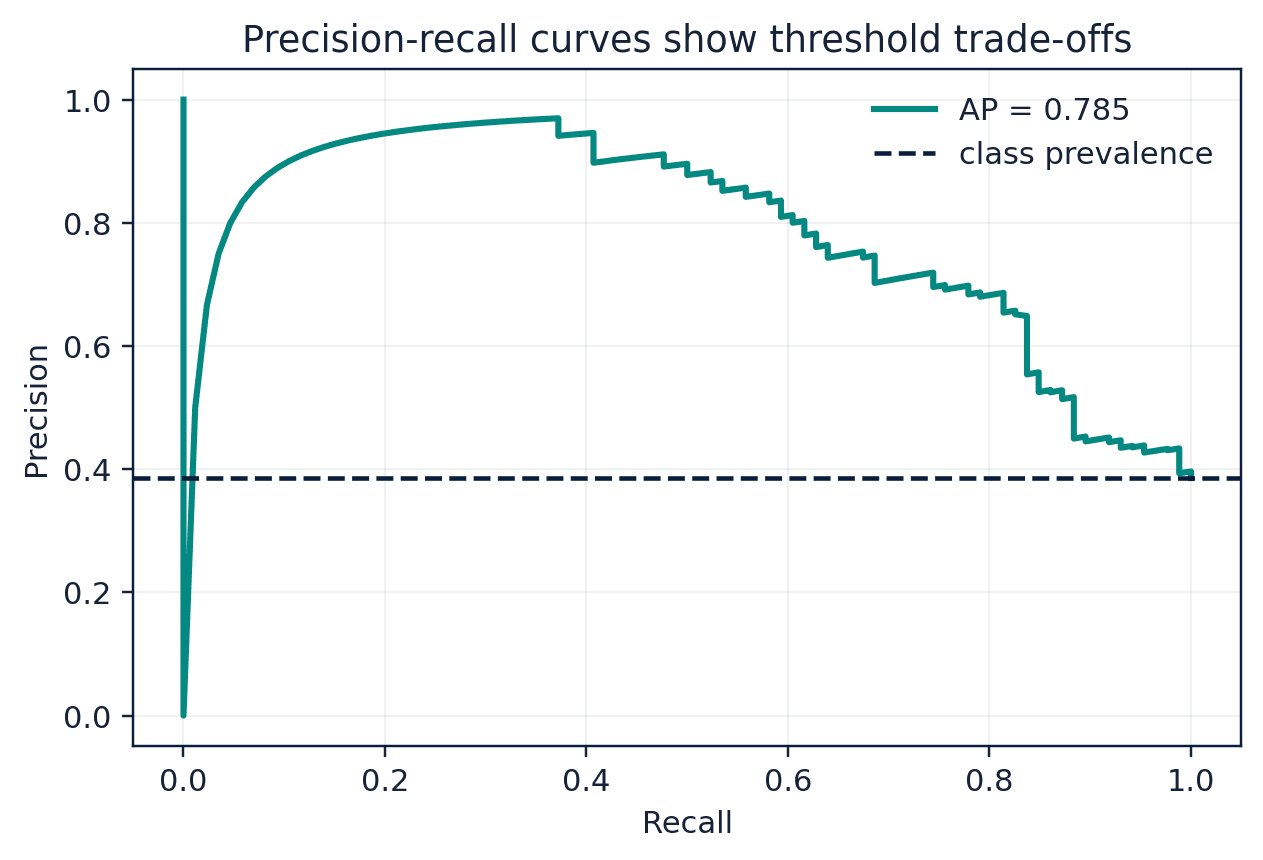
The Titanic dataset illustrates categorical and numeric preprocessing, missing values, class probabilities, and threshold-dependent decisions. Accuracy can conceal failure on a minority class. Precision answers how often predicted positives are correct; recall answers how many actual positives were found; F1 balances the two harmonically. A confusion matrix grounds these metrics in counts. Historical social structures also mean that model patterns should not be treated as neutral prescriptions.
48.4
Baselines make improvement meaningful
A regression baseline may predict the training mean; a classification baseline may predict the majority class or observed prevalence. Complex models should outperform these baselines on held-out data and justify their additional complexity. Cross-validation estimates variability across splits, but the folds must respect groups or time when observations are related. Final analysis includes errors, not only averages: which houses are badly predicted and which passenger subgroups are misclassified?
48.5
Core equations
Precision
Among predicted positives, the fraction that are true positives.
Recall
Among actual positives, the fraction that are found.
48.6
Python demonstrations
48.6.1
Demonstration 29.1: Tehran housing regression
Verified output
Interpretation. The slope is a predictive association in the dataset’s currency units per square metre, not a causal valuation rule.
48.6.2
Demonstration 29.2: Titanic pipeline and metrics
Verified output
Interpretation. The three metrics illuminate different error trade-offs. Exact values are tied to the documented split and preprocessing.
48.7
Visual evidence
48.8
Reference table
Why This Matters
End-to-end projects teach that data preparation, baselines, evaluation design, and error analysis matter as much as the estimator.
Common Mistake
Reporting only the highest cross-validation score after trying many models and feature sets without preserving a final test set.
Ceteris LAB Tip
Keep a model comparison table that includes baseline, preprocessing, split, metric, and uncertainty.
R-to-Python / Source Bridge
These projects adapt the Tehran housing and Titanic notebooks from IntroAI sessions 4 to 6 under the archive’s CC BY licence, with new pipelines, leakage controls, and interpretation (Sharifi-Zarchi and contributors 2026).
| Metric | Best interpreted as | Limitation |
|---|---|---|
| MAE | average absolute prediction error | same scale but ignores direction |
| RMSE | square-error-sensitive error | strongly weights extremes |
| accuracy | overall correct fraction | misleading under imbalance |
| precision | reliability of positive predictions | depends on threshold/prevalence |
| recall | coverage of actual positives | can increase false positives |
| ROC-AUC | ranking across thresholds | can obscure class imbalance |
Visual evidence
Additional Python demonstrations
Live Python
Source demonstration 2
Source demonstration 2
Stdout
Run Python to see results here.
Status / stderr
Ready to run Python in your browser.
Line-by-line guide
- Line 1Load a Python library needed for data work or regression.
- Line 2Load a Python library needed for data work or regression.
- Line 3Load a Python library needed for data work or regression.
- Line 4Load a Python library needed for data work or regression.
- Line 5Load a Python library needed for data work or regression.
- Line 7Create or update a Python object used in the analysis.
- Line 8Create or update a Python object used in the analysis.
- Line 9Create or update a Python object used in the analysis.
- Line 10Run this Python instruction as part of the lesson workflow.
- Line 11Run this Python instruction as part of the lesson workflow.
- Line 12Run this Python instruction as part of the lesson workflow.
- Line 13Run this Python instruction as part of the lesson workflow.
- Line 14Create or update a Python object used in the analysis.
- Line 15Create or update a Python object used in the analysis.
- Line 16Create or update a Python object used in the analysis.
- Line 17Create or update a Python object used in the analysis.
- Line 18Create or update a Python object used in the analysis.
- Line 19Run this Python instruction as part of the lesson workflow.
- Line 20Create or update a Python object used in the analysis.
- Line 21Create or update a Python object used in the analysis.
- Line 22Display a result so students can inspect the output.
- Line 23Run this Python instruction as part of the lesson workflow.
- Line 24Run this Python instruction as part of the lesson workflow.
- Line 25Run this Python instruction as part of the lesson workflow.
- Line 26Run this Python instruction as part of the lesson workflow.
Verified source output
84427668.1238 3473
0.789 0.719 0.744
Interpretation. The slope is a predictive association in the dataset’s currency units per square metre, not a causal valuation rule.
Interpretation. The three metrics illuminate different error trade-offs. Exact values are tied to the documented split and preprocessing.
Guided practice
- 1Re-run Demonstration 29.1 and change one input while keeping the analytical question fixed.
- 2Explain in two sentences how the output supports, or fails to support, the chapter opening question.
- 3Add one validation check that would prevent a plausible error.
Exercises
- 1Add categorical features to the housing model.
- 2Compare linear, tree, and random-forest regressors.
- 3Build a Titanic confusion matrix.
- 4Move the classification threshold and trace precision-recall trade-offs.
Source and downloads
Chapter 48 of Fundamentals of Python for Financial Econometrics by Mohammad Safavi, Ph.D.. The lesson is an original Ceteris Lab web adaptation of the supplied publication package.
Live Python
Applied Economic Prediction and Classification Projects: live Python
Applied Economic Prediction and Classification Projects: live Python
Stdout
Run Python to see results here.
Status / stderr
Ready to run Python in your browser.
Line-by-line guide
- Line 1Load a Python library needed for data work or regression.
- Line 2Load a Python library needed for data work or regression.
- Line 3Load a Python library needed for data work or regression.
- Line 5Create or update a Python object used in the analysis.
- Line 6Create or update a Python object used in the analysis.
- Line 7Create or update a Python object used in the analysis.
- Line 8Create or update a Python object used in the analysis.
- Line 9Create or update a Python object used in the analysis.
- Line 10Display a result so students can inspect the output.
Python walkthrough
- 1`import numpy as np`: Loads a package or function used by the analysis.
- 2`import pandas as pd`: Loads a package or function used by the analysis.
- 3`from sklearn.linear_model import LinearRegression`: Loads a package or function used by the analysis.
- 4`rng = np.random.default_rng(48)`: Creates or updates a named object used by later steps.
- 5`area = rng.uniform(45, 240, 500)`: Creates or updates a named object used by later steps.
- 6`price = 85_000 + 3_250 * area + rng.normal(0, 55_000, 500)`: Creates or updates a named object used by later steps.
- 7`houses = pd.DataFrame({"area": area, "price": price})`: Creates or updates a named object used by later steps.
- 8`model = LinearRegression().fit(houses[["area"]], houses["price"])`: Fits the specified statistical or machine-learning model.
- 9`print(round(float(model.coef_[0]), 2), len(houses))`: Displays a result so it can be checked and interpreted.
Live notebook
Run this lesson as a notebook
Open an editable notebook cell-by-cell, run Python in the browser, and download the `.ipynb` file for later.
Related dataset
Ceteris Lab teaching sample
Estimated time
35 to 55 min
Packages
pandas, numpy, matplotlib, statsmodels, patsy
Expected output
A regression or inference table with coefficients, uncertainty, and short interpretation notes.
Learning goals
- Load and inspect Ceteris Lab teaching sample.
- Run the Python cells connected to Applied Economic Prediction and Classification Projects.
- Interpret the output using Build a regression workflow with the Tehran housing data and Build a classification workflow with Titanic data.
Common errors
- File not found: check that wage_sample.csv is installed or use the course data folder.
- Package import error: use the browser notebook first, then download for local Jupyter if your local packages differ.
- Column name error: compare your variable names with the dataset variables listed for this notebook.
Dataset path helper
import pandas as pd

df = pd.read_csv("/data/wage_sample.csv")
df.head()
Interactive activity
Chapter 48 interactive
Model governance check
What is the safest basis for evaluating an ML or AI result?
Immediate feedback
Choose a decision, then test how the claim changes as evidence becomes stronger or weaker.
Try it yourself
Write one plain-English sentence explaining the main idea from this lesson.
Common mistakes
Check these before you move on.
Return to the lesson assumptions, units, diagnostics, and source evidence to replace this shortcut with a defensible interpretation.
Quick quiz
Which statement best answers the Chapter 48 opening question: How can an end-to-end workflow turn housing and passenger data into models that are evaluated honestly and interpreted carefully?
Quick quiz
Which practice should be avoided when applying Applied Economic Prediction and Classification Projects?
Quick quiz
What is the most defensible way to interpret the Python demonstration?
Quick quiz
Why does Chapter 48 matter in an applied econometrics workflow?
Key takeaway
Housing regression demonstrates continuous prediction and residual analysis. Titanic demonstrates classification, imbalance, and threshold metrics. Baselines and held-out evaluation make improvement interpretable.