Lesson 50
Computer Vision and Spatial Economic Measurement
Big question
How does a model transform pixels into useful local patterns without being told the exact edge or texture to search for?
Lesson progress
Complete checkpoints as you learn
Learning objectives
- Represent images as arrays.
- Explain convolution, stride, padding, and channels.
- Describe CNNs, augmentation, and transfer learning.
- Evaluate errors, bias, and privacy.
- Prerequisites: Chapters 8 and 30.
- Key terms: pixel, channel, convolution, kernel, padding, transfer learning.
Simple explanation
A grayscale image is a two-dimensional array; a colour image commonly adds a channel axis. Pixel scale, channel order, and spatial dimensions must be documented. Resizing changes information, and normalization affects optimization. Plotting a few images and labels is a basic data audit that can reveal corrupted files, wrong orientation, or class leakage.
Key terms
- Represent images as arrays
- A core idea in Chapter 50 that students apply carefully in economic analysis.
- convolution, stride, padding, and channels
- A core idea in Chapter 50 that students apply carefully in economic analysis.
- CNNs, augmentation, and transfer learning
- A core idea in Chapter 50 that students apply carefully in economic analysis.
- Evaluate errors, bias, and privacy
- A core idea in Chapter 50 that students apply carefully in economic analysis.
- Prerequisites: Chapters 8 and 30
- A core idea in Chapter 50 that students apply carefully in economic analysis.
- Key terms: pixel, channel, convolution, kernel, padding, transfer learning
- A core idea in Chapter 50 that students apply carefully in economic analysis.
Analytical workflow
Interpret the expression in words and units before using it in a claim.
Example
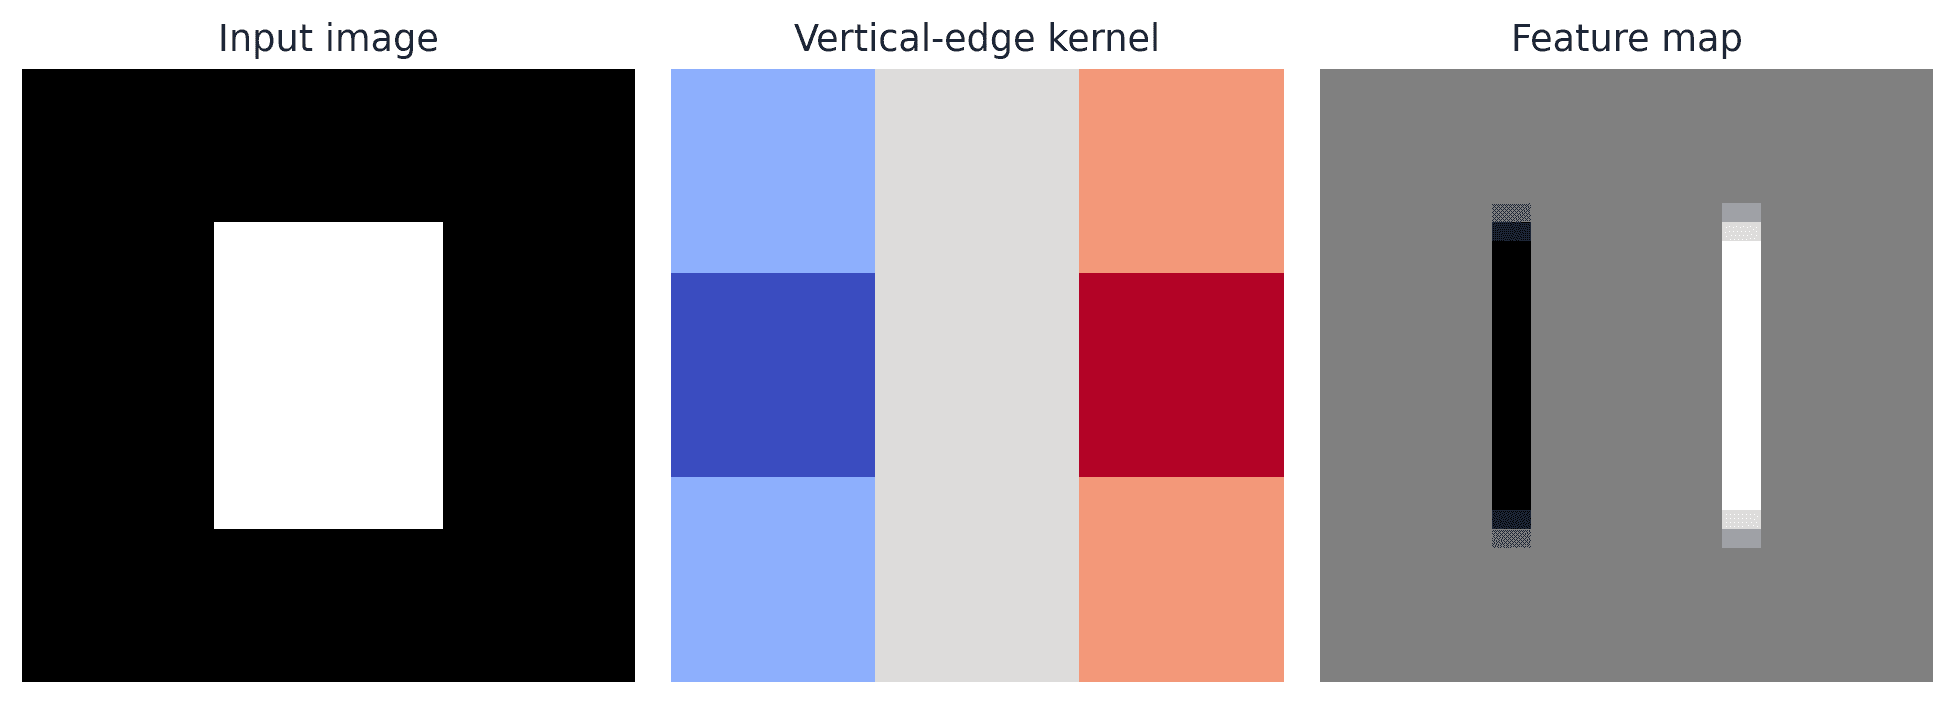
Interpretation. The vertical edge creates a strong response where intensity changes across columns.
Prerequisites
- Complete the preceding course chapters or review their summaries as needed.
Full theory and examples
50.2
Images are structured tensors
A grayscale image is a two-dimensional array; a colour image commonly adds a channel axis. Pixel scale, channel order, and spatial dimensions must be documented. Resizing changes information, and normalization affects optimization. Plotting a few images and labels is a basic data audit that can reveal corrupted files, wrong orientation, or class leakage.
50.3
Convolution searches locally with shared weights
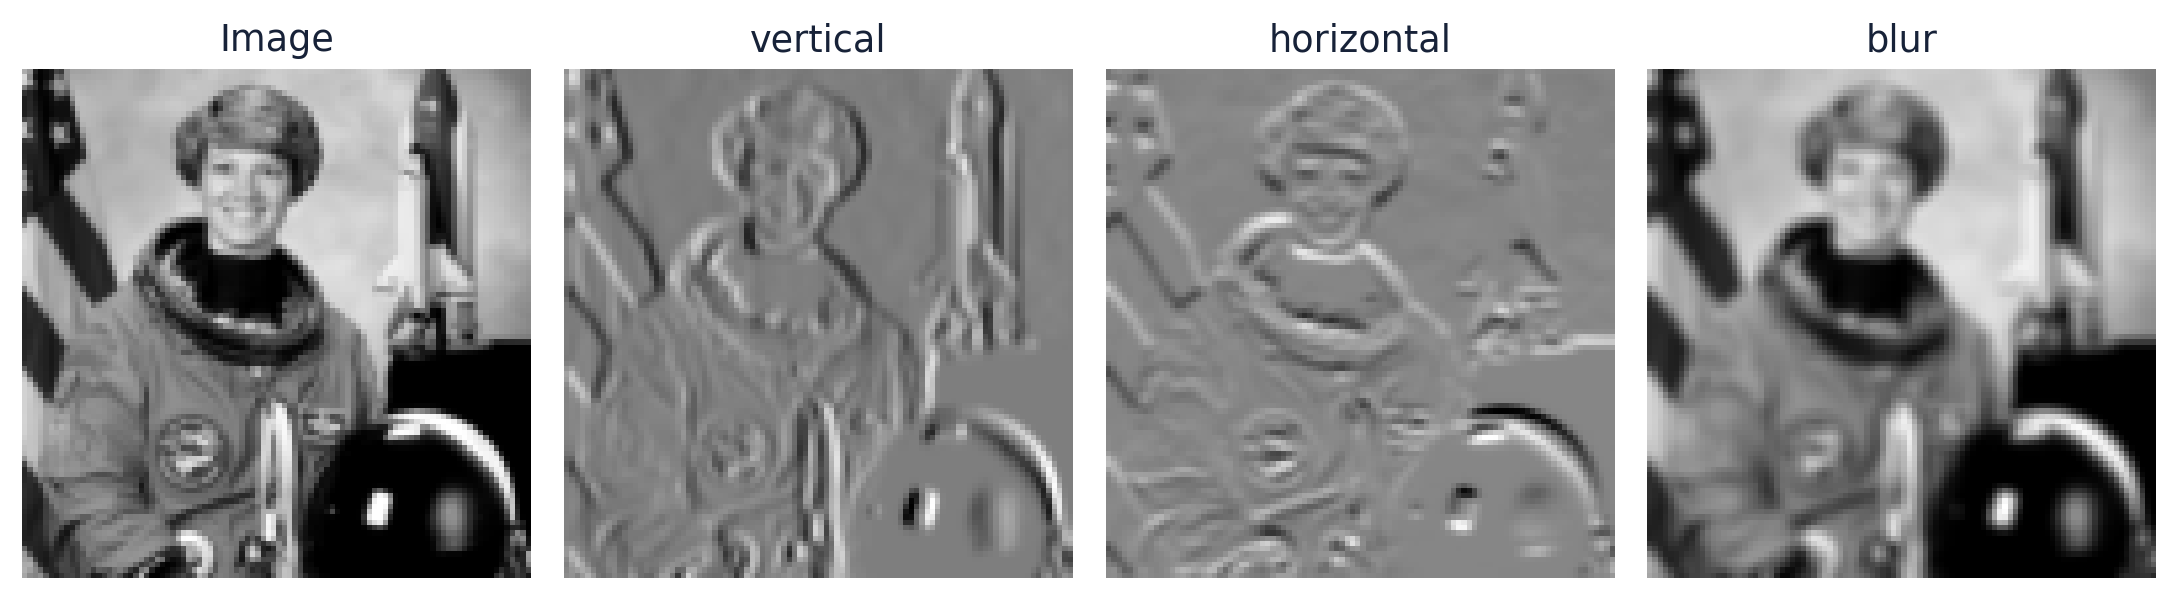
A convolution slides a small kernel across the image and computes local weighted sums. Weight sharing lets one pattern detector operate in many positions, reducing parameters relative to a fully connected layer. Stride controls movement; padding controls border treatment; multiple filters produce feature maps. Deeper layers combine edges and textures into task-specific representations.
50.4
Transfer learning is borrowed representation, not borrowed truth
A pretrained network can supply useful visual features when the new dataset is small. Fine-tuning adapts some or all weights. Performance depends on similarity between source and target images, class balance, image quality, and deployment conditions. Augmentation should represent plausible variation rather than alter the label. Vision systems can encode demographic bias and expose sensitive images, so privacy and subgroup evaluation are essential.
50.5
Core equations
Discrete convolution
A kernel K aggregates a local neighbourhood of image X into an output feature Y.
50.6
Python demonstrations
50.6.1
Demonstration 31.1: Apply a simple edge kernel
Verified output
Interpretation. The vertical edge creates a strong response where intensity changes across columns.
50.6.2
Demonstration 31.2: Inspect a tensor shape
Verified output
Interpretation. Padding preserves height and width, while eight learned filters replace the three input channels.
50.7
Visual evidence
50.8
Reference table
Why This Matters
Computer vision combines spatial structure with learned representations, but deployment validity depends on the image-generating context.
Common Mistake
Applying augmentation that changes the label, such as flipping a directional medical image without checking domain meaning.
Ceteris LAB Tip
Inspect misclassified images by subgroup and acquisition source, not only the aggregate accuracy.
R-to-Python / Source Bridge
The chapter adapts IntroAI session 8 on convolution, padding, channels, augmentation, CNNs, and transfer learning, using new original diagrams instead of source screenshots (Sharifi-Zarchi and contributors 2026).
| Choice | Effect | Question |
|---|---|---|
| kernel size | local receptive field | What pattern scale matters? |
| stride | downsampling | Will detail be lost? |
| padding | output size/border handling | How should edges be treated? |
| augmentation | synthetic variation | Does it preserve the label? |
| pretraining | initial representation | Is the source domain relevant? |
Visual evidence
Additional Python demonstrations
Live Python
Source demonstration 2
Source demonstration 2
Stdout
Run Python to see results here.
Status / stderr
Ready to run Python in your browser.
Line-by-line guide
- Line 1Load a Python library needed for data work or regression.
- Line 3Create or update a Python object used in the analysis.
- Line 4Create or update a Python object used in the analysis.
- Line 5Create or update a Python object used in the analysis.
- Line 6Create or update a Python object used in the analysis.
- Line 7Create or update a Python object used in the analysis.
- Line 8Create or update a Python object used in the analysis.
- Line 9Display a result so students can inspect the output.
- Line 10Display a result so students can inspect the output.
Verified source output
3.0 (8, 8)
(16, 8, 64, 64)
Interpretation. The vertical edge creates a strong response where intensity changes across columns.
Interpretation. Padding preserves height and width, while eight learned filters replace the three input channels.
Guided practice
- 1Re-run Demonstration 31.1 and change one input while keeping the analytical question fixed.
- 2Explain in two sentences how the output supports, or fails to support, the chapter opening question.
- 3Add one validation check that would prevent a plausible error.
Exercises
- 1Convolve an image with blur and edge kernels.
- 2Compare output shapes under two padding choices.
- 3Design three label-preserving augmentations.
- 4Write a transfer-learning evaluation plan.
Source and downloads
Chapter 50 of Fundamentals of Python for Financial Econometrics by Mohammad Safavi, Ph.D.. The lesson is an original Ceteris Lab web adaptation of the supplied publication package.
Live Python
Computer Vision and Spatial Economic Measurement: live Python
Computer Vision and Spatial Economic Measurement: live Python
Stdout
Run Python to see results here.
Status / stderr
Ready to run Python in your browser.
Line-by-line guide
- Line 1Load a Python library needed for data work or regression.
- Line 3Create or update a Python object used in the analysis.
- Line 4Create or update a Python object used in the analysis.
- Line 5Create or update a Python object used in the analysis.
- Line 6Create or update a Python object used in the analysis.
- Line 7Create or update a Python object used in the analysis.
- Line 8Create or update a Python object used in the analysis.
- Line 9Display a result so students can inspect the output.
Python walkthrough
- 1`import numpy as np`: Loads a package or function used by the analysis.
- 2`image = np.zeros((8, 8))`: Creates or updates a named object used by later steps.
- 3`image[:, 4:] = 1`: Creates or updates a named object used by later steps.
- 4`kernel = np.array([[-1, 0, 1], [-1, 0, 1], [-1, 0, 1]])`: Creates or updates a named object used by later steps.
- 5`padded = np.pad(image, 1, mode="symmetric")`: Creates or updates a named object used by later steps.
- 6`windows = np.lib.stride_tricks.sliding_window_view(padded, (3, 3))`: Creates or updates a named object used by later steps.
- 7`feature = np.einsum("ijkl,kl->ij", windows, kernel)`: Creates or updates a named object used by later steps.
- 8`print(float(np.abs(feature).max()), feature.shape)`: Displays a result so it can be checked and interpreted.
Live notebook
Run this lesson as a notebook
Open an editable notebook cell-by-cell, run Python in the browser, and download the `.ipynb` file for later.
Related dataset
Ceteris Lab teaching sample
Estimated time
25 to 40 min
Packages
pandas, numpy
Expected output
Printed Python results that can be compared with the lesson explanation.
Learning goals
- Load and inspect Ceteris Lab teaching sample.
- Run the Python cells connected to Computer Vision and Spatial Economic Measurement.
- Interpret the output using Represent images as arrays and convolution, stride, padding, and channels.
Common errors
- File not found: check that wage_sample.csv is installed or use the course data folder.
- Package import error: use the browser notebook first, then download for local Jupyter if your local packages differ.
- Column name error: compare your variable names with the dataset variables listed for this notebook.
Dataset path helper
import pandas as pd

df = pd.read_csv("/data/wage_sample.csv")
df.head()
Interactive activity
Chapter 50 interactive
Model governance check
What is the safest basis for evaluating an ML or AI result?
Immediate feedback
Choose a decision, then test how the claim changes as evidence becomes stronger or weaker.
Try it yourself
Write one plain-English sentence explaining the main idea from this lesson.
Common mistakes
Check these before you move on.
Return to the lesson assumptions, units, diagnostics, and source evidence to replace this shortcut with a defensible interpretation.
Quick quiz
Which statement best answers the Chapter 50 opening question: How does a model transform pixels into useful local patterns without being told the exact edge or texture to search for?
Quick quiz
Which practice should be avoided when applying Computer Vision and Spatial Economic Measurement?
Quick quiz
What is the most defensible way to interpret the Python demonstration?
Quick quiz
Why does Chapter 50 matter in an applied econometrics workflow?
Key takeaway
Images are tensors with spatial and channel structure. Convolution uses local shared filters. Transfer learning and augmentation require domain-valid assumptions.