Lesson 53
Capstone Projects and Student Portfolio
Big question
How can a student transform code fragments into a defensible, reproducible analytical product for the Ceteris LAB website or a professional portfolio?
Lesson progress
Complete checkpoints as you learn
Learning objectives
- Plan a complete project from question to communication.
- Use authoritative data and a data dictionary.
- Compare baseline and advanced models out of sample.
- Package code, figures, limitations, and reproducibility files.
- Prerequisites: All previous chapters.
- Key terms: capstone, data dictionary, benchmark, model comparison, reproducible report, portfolio.
Simple explanation
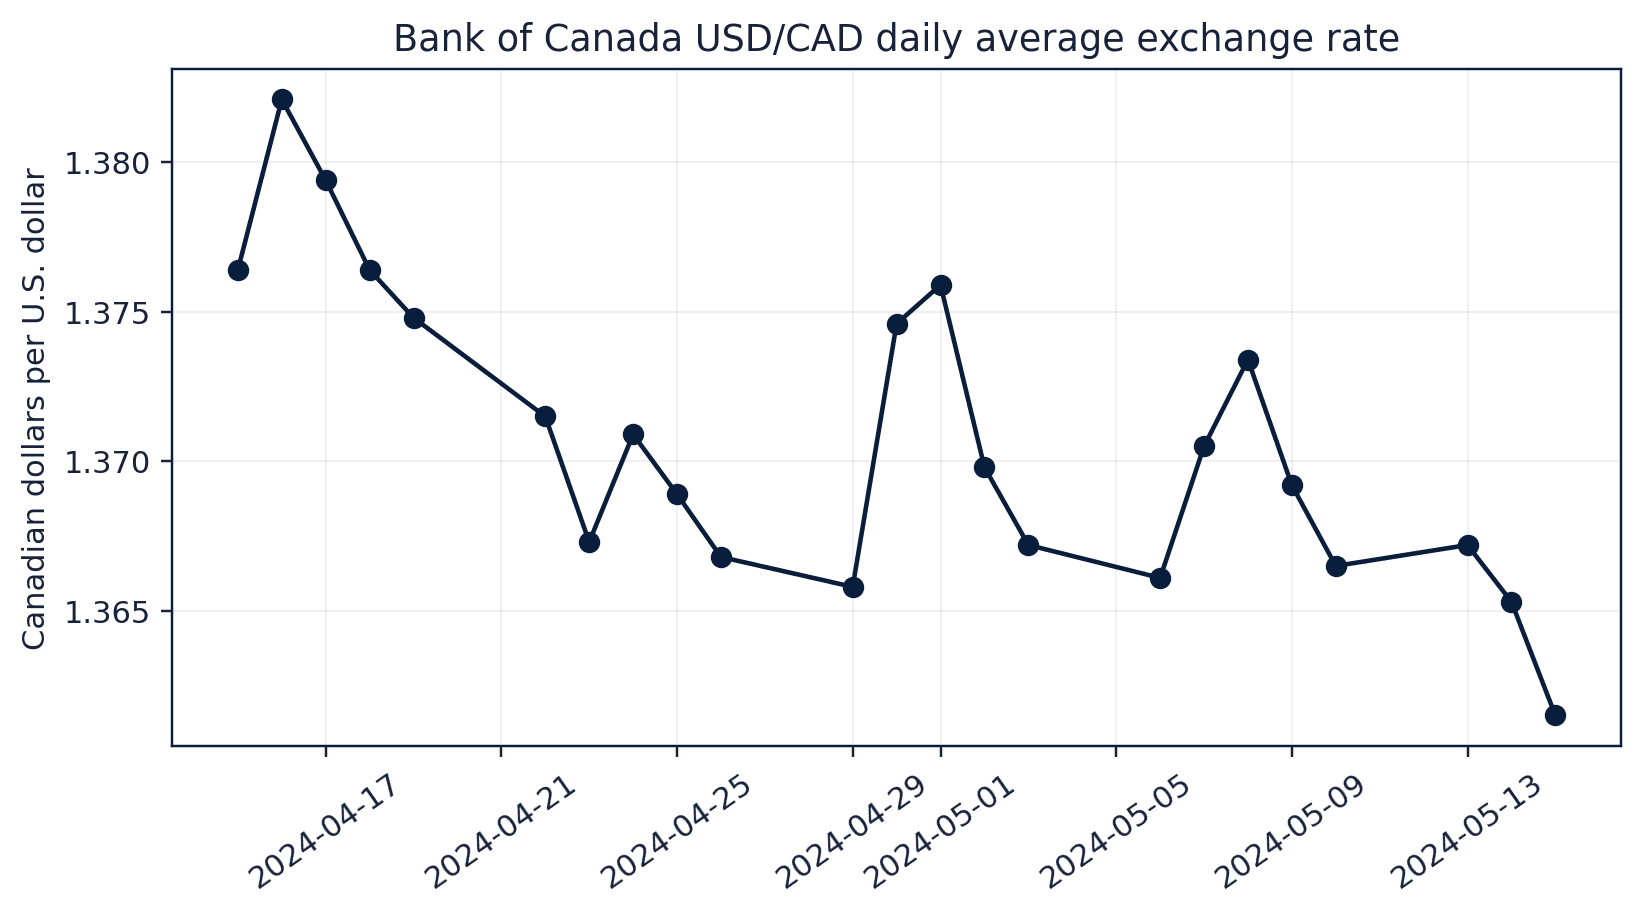
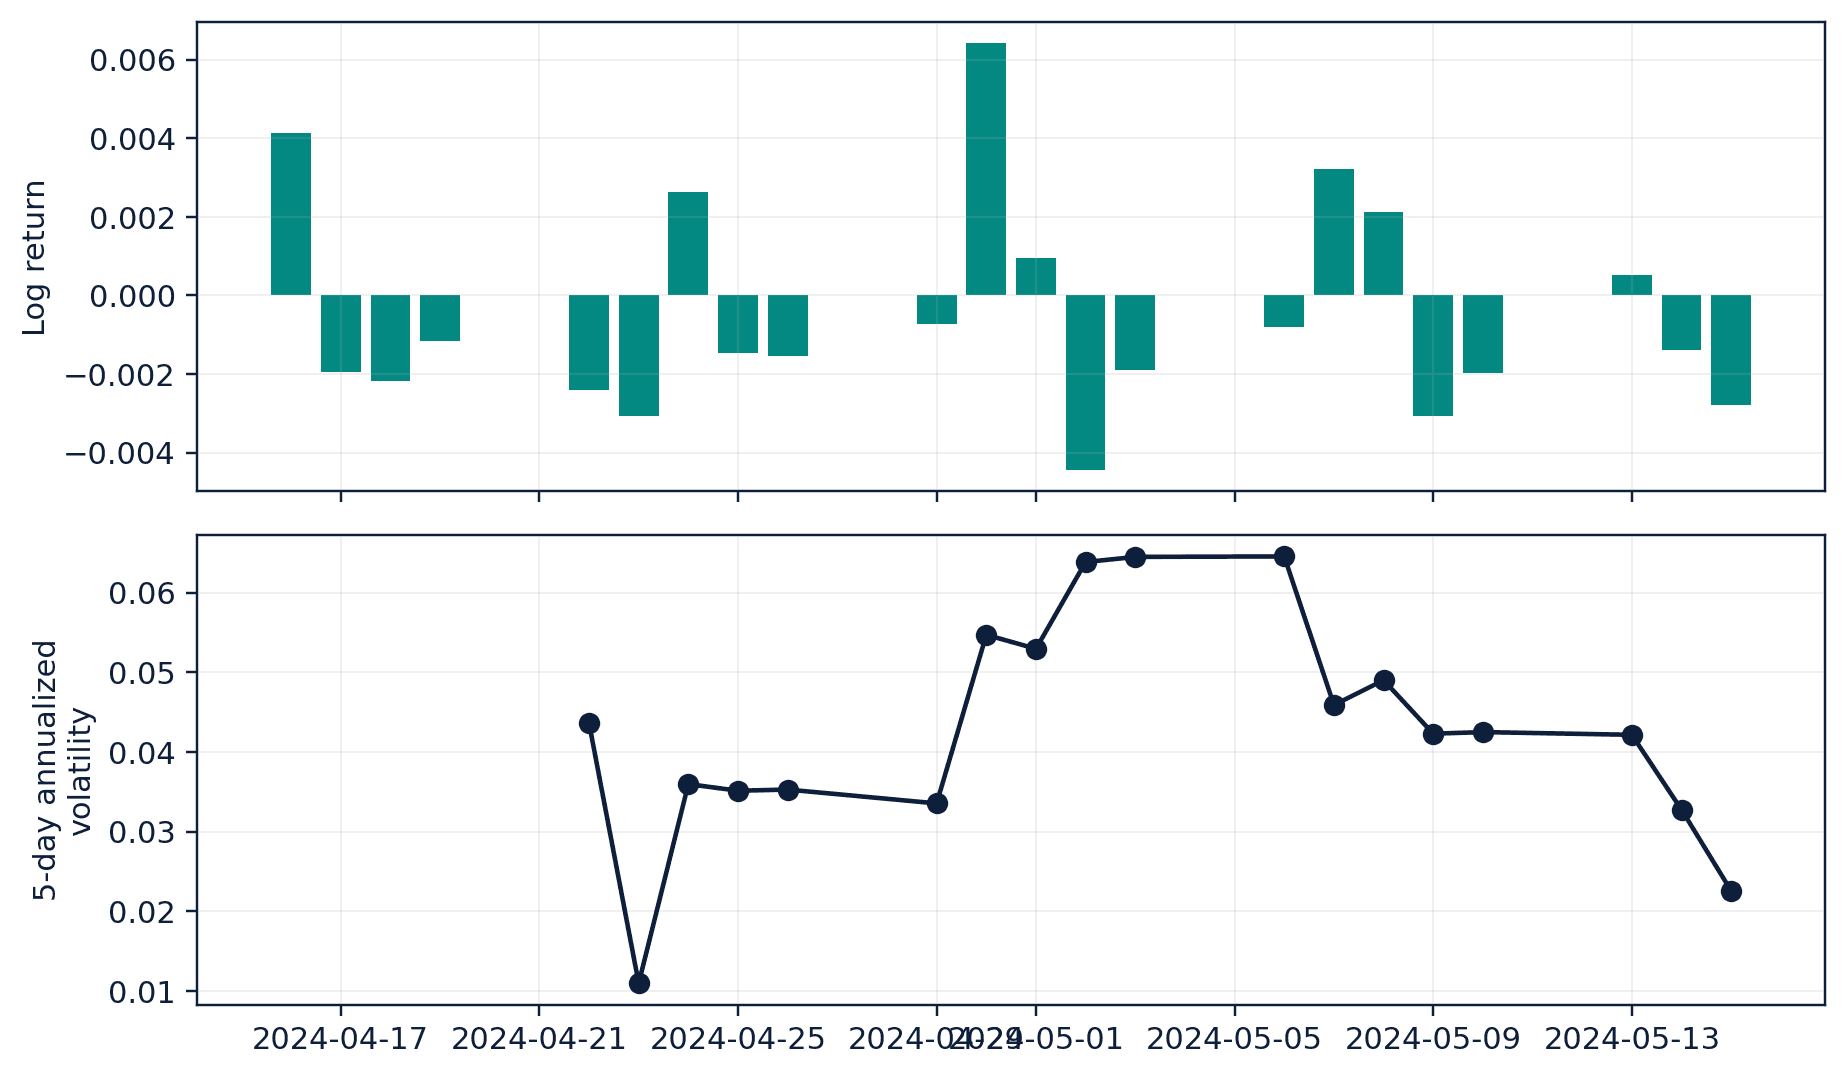
Use the Bank of Canada FXUSDCAD series or another official Canadian series. State a forecast question and horizon, preserve the frozen raw extract, document units and frequency, transform the series, compare a naive benchmark with at least two models, and evaluate on a later period. Discuss revisions, market closures, short samples, and the difference between statistical forecast accuracy and economic value.
Key terms
- Plan a complete project from question to communication
- A core idea in Chapter 53 that students apply carefully in economic analysis.
- authoritative data and a data dictionary
- A core idea in Chapter 53 that students apply carefully in economic analysis.
- Compare baseline and advanced models out of sample
- A core idea in Chapter 53 that students apply carefully in economic analysis.
- Package code, figures, limitations, and reproducibility files
- A core idea in Chapter 53 that students apply carefully in economic analysis.
- Prerequisites: All previous chapters
- A core idea in Chapter 53 that students apply carefully in economic analysis.
- Key terms: capstone, data dictionary, benchmark, model comparison, reproducible report, portfolio
- A core idea in Chapter 53 that students apply carefully in economic analysis.
Analytical workflow
Interpret the expression in words and units before using it in a claim.
Example
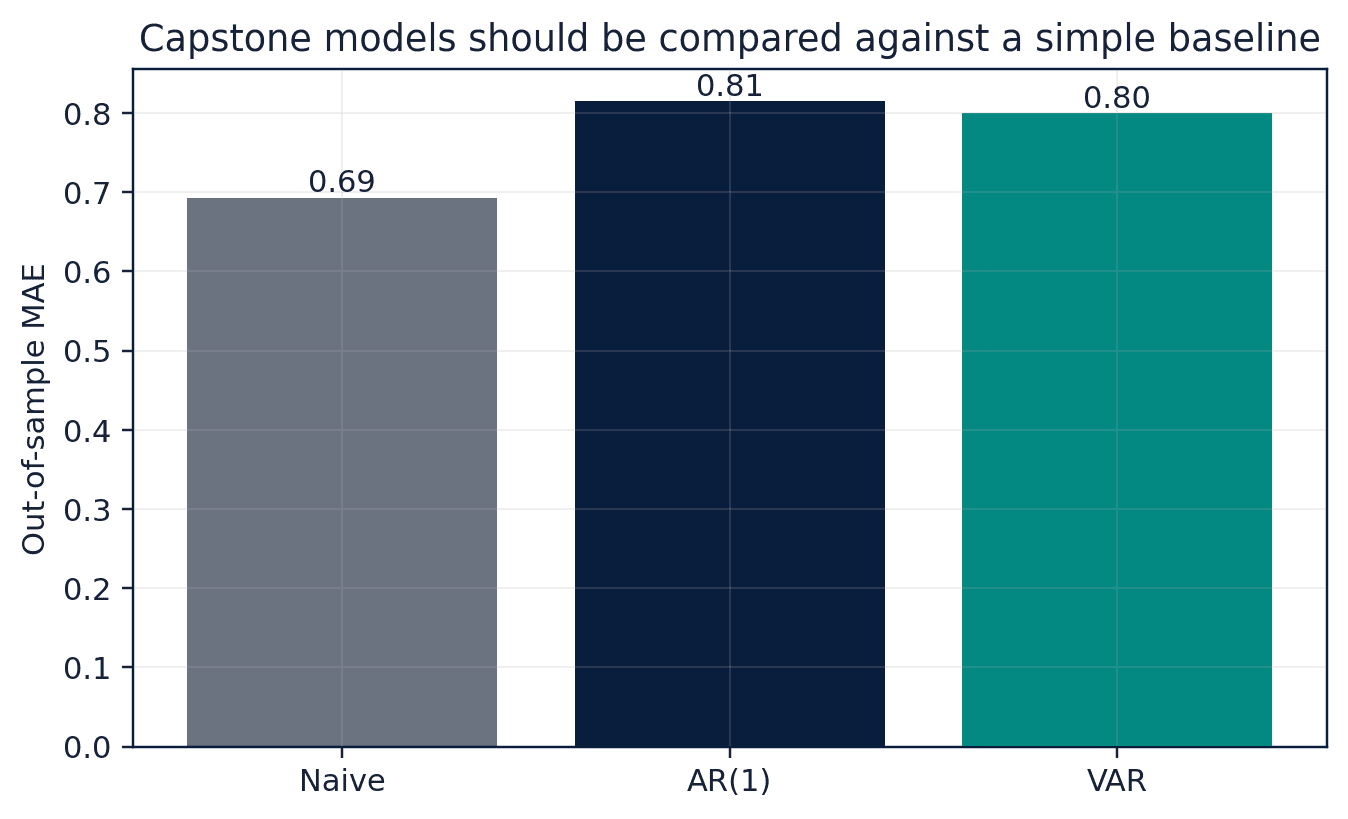
Interpretation. The advanced model improves only modestly over the naive benchmark, so uncertainty and practical relevance should accompany the ranking.
Prerequisites
- Complete the preceding course chapters or review their summaries as needed.
Full theory and examples
53.2
Capstone A: Canadian exchange-rate forecasting
Use the Bank of Canada FXUSDCAD series or another official Canadian series. State a forecast question and horizon, preserve the frozen raw extract, document units and frequency, transform the series, compare a naive benchmark with at least two models, and evaluate on a later period. Discuss revisions, market closures, short samples, and the difference between statistical forecast accuracy and economic value.
53.3
Capstone B: inflation and interest-rate dashboard
Build a reproducible dashboard from official Canadian CPI and policy-rate sources. Distinguish headline, core, monthly, and year-over-year measures. Add source notes, retrieval dates, and an explanation of revisions. Use charts to communicate trends, not to imply that co-movement proves a policy effect. Include a plain-language summary and a technical appendix.
53.4
Capstones C and D: risk and AI
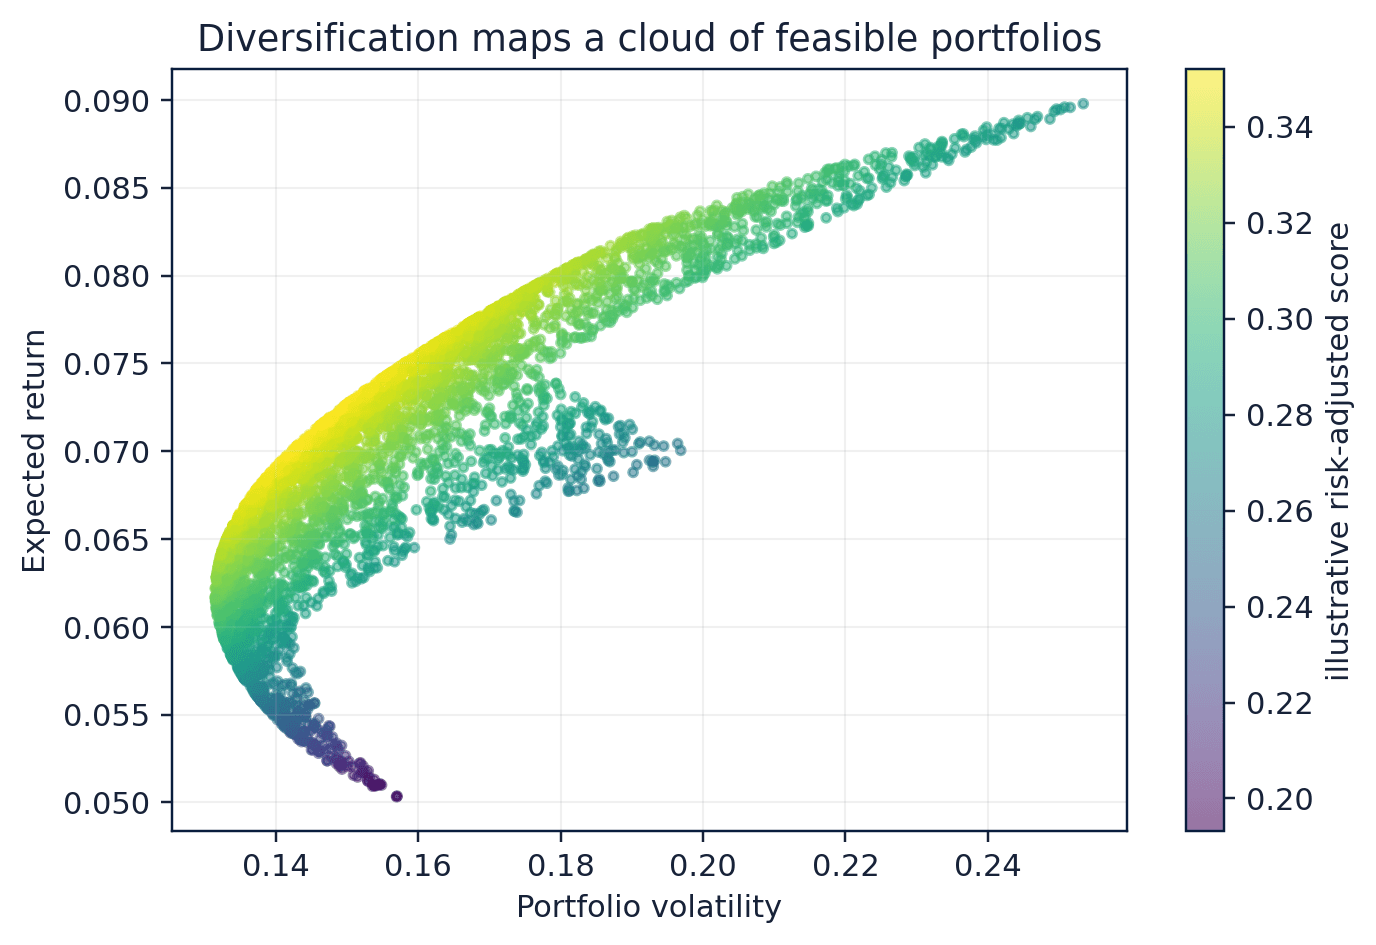
A financial-risk project can compare historical, parametric, and GARCH-based VaR and ES with an expanding-window backtest. An AI project can compare baseline and advanced models on a clearly licensed dataset, preserve a final test set, inspect errors, and discuss fairness, privacy, and deployment shift. Every portfolio project should include a README, environment file, notebook, script, data instructions, figures, and an honest limitations section.
53.5
Python demonstrations
53.5.1
Demonstration 34.1: A simple model-comparison table
Verified output
Interpretation. The advanced model improves only modestly over the naive benchmark, so uncertainty and practical relevance should accompany the ranking.
53.5.2
Demonstration 34.2: A reproducibility manifest
Verified output
Interpretation. A manifest is not proof of quality, but it catches missing package components before publication.
53.6
Visual evidence
53.7
Reference table
Why This Matters
A capstone becomes professional when the data, code, evaluation, communication, and limitations form one auditable argument.
Common Mistake
Choosing a project because a complex model is available rather than because the question matters and the data can support it.
Ceteris LAB Tip
Begin the README on the first day. It will expose missing decisions while they are still easy to correct.
R-to-Python / Source Bridge
The capstones combine the strongest elements of the financial-time-series lectures, the IntroAI projects, and new Canadian applications into website-ready student work.
| Deliverable | Minimum content | Acceptance question |
|---|---|---|
| research question | population, outcome, horizon | Is it answerable with available data? |
| data package | source, licence, dictionary, retrieval | Can another student obtain it? |
| analysis | baseline, model, diagnostics | Does code run top to bottom? |
| evaluation | held-out design and metrics | Does it mimic deployment? |
| communication | figures, interpretation, limits | Are claims proportional to evidence? |
| reproducibility | README and environment | Can the result be rebuilt? |
Visual evidence
Additional Python demonstrations
Live Python
Source demonstration 2
Source demonstration 2
Stdout
Run Python to see results here.
Status / stderr
Ready to run Python in your browser.
Line-by-line guide
- Line 1Load a Python library needed for data work or regression.
- Line 3Create or update a Python object used in the analysis.
- Line 4Create or update a Python object used in the analysis.
- Line 5Create or update a Python object used in the analysis.
- Line 6Display a result so students can inspect the output.
Verified source output
model     MAE    RMSE  MAE_rank
1          ARIMA  0.0118  0.0160         1
2  random_forest  0.0121  0.0164         2
0          naive  0.0124  0.0168         3
{'README.md': True, 'requirements.txt': True, 'data': True, 'notebooks': True, 'scripts': True, 'figures': True}model MAE RMSE MAE_rank 1 ARIMA 0.0118 0.0160 1 2 random_forest 0.0121 0.0164 2 0 naive 0.0124 0.0168 3
import pandas as pd
results = pd.DataFrame({
results["MAE_rank"] = results["MAE"].rank(method="min").astype(int)
print(results.sort_values("MAE"))
from pathlib import Path
root = Path.cwd()
Interpretation. The advanced model improves only modestly over the naive benchmark, so uncertainty and practical relevance should accompany the ranking.
Interpretation. A manifest is not proof of quality, but it catches missing package components before publication.
Guided practice
- 1Re-run Demonstration 34.1 and change one input while keeping the analytical question fixed.
- 2Explain in two sentences how the output supports, or fails to support, the chapter opening question.
- 3Add one validation check that would prevent a plausible error.
Exercises
- 1Draft a one-paragraph project question and scope.
- 2Create a data dictionary before modeling.
- 3Define a naive benchmark and final test design.
- 4Build a publication checklist covering data rights, code execution, figures, and claims.
Source and downloads
Chapter 53 of Fundamentals of Python for Financial Econometrics by Mohammad Safavi, Ph.D.. The lesson is an original Ceteris Lab web adaptation of the supplied publication package.
Live Python
Capstone Projects and Student Portfolio: live Python
Capstone Projects and Student Portfolio: live Python
Stdout
Run Python to see results here.
Status / stderr
Ready to run Python in your browser.
Line-by-line guide
- Line 1Load a Python library needed for data work or regression.
- Line 3Create or update a Python object used in the analysis.
- Line 4Run this Python instruction as part of the lesson workflow.
- Line 5Run this Python instruction as part of the lesson workflow.
- Line 6Run this Python instruction as part of the lesson workflow.
- Line 7Run this Python instruction as part of the lesson workflow.
- Line 8Create or update a Python object used in the analysis.
- Line 9Display a result so students can inspect the output.
Python walkthrough
- 1`import pandas as pd`: Loads a package or function used by the analysis.
- 2`results = pd.DataFrame({`: Creates or updates a named object used by later steps.
- 3`"model": ["naive", "ARIMA", "random_forest"],`: Executes the next transparent step in the workflow.
- 4`"MAE": [0.0124, 0.0118, 0.0121],`: Executes the next transparent step in the workflow.
- 5`"RMSE": [0.0168, 0.0160, 0.0164],`: Executes the next transparent step in the workflow.
- 6`})`: Executes the next transparent step in the workflow.
- 7`results["MAE_rank"] = results["MAE"].rank(method="min").astype(int)`: Creates or updates a named object used by later steps.
- 8`print(results.sort_values("MAE"))`: Displays a result so it can be checked and interpreted.
Live notebook
Run this lesson as a notebook
Open an editable notebook cell-by-cell, run Python in the browser, and download the `.ipynb` file for later.
Related dataset
Ceteris Lab teaching sample
Estimated time
35 to 55 min
Packages
pandas, numpy
Expected output
Printed Python results that can be compared with the lesson explanation.
Learning goals
- Load and inspect Ceteris Lab teaching sample.
- Run the Python cells connected to Capstone Projects and Student Portfolio.
- Interpret the output using Plan a complete project from question to communication and authoritative data and a data dictionary.
Common errors
- File not found: check that wage_sample.csv is installed or use the course data folder.
- Package import error: use the browser notebook first, then download for local Jupyter if your local packages differ.
- Column name error: compare your variable names with the dataset variables listed for this notebook.
Dataset path helper
import pandas as pd

df = pd.read_csv("/data/wage_sample.csv")
df.head()
Interactive activity
Chapter 53 interactive
Model governance check
What is the safest basis for evaluating an ML or AI result?
Immediate feedback
Choose a decision, then test how the claim changes as evidence becomes stronger or weaker.
Try it yourself
Write one plain-English sentence explaining the main idea from this lesson.
Common mistakes
Check these before you move on.
Return to the lesson assumptions, units, diagnostics, and source evidence to replace this shortcut with a defensible interpretation.
Quick quiz
Which statement best answers the Chapter 53 opening question: How can a student transform code fragments into a defensible, reproducible analytical product for the Ceteris LAB website or a professional portfolio?
Quick quiz
Which practice should be avoided when applying Capstone Projects and Student Portfolio?
Quick quiz
What is the most defensible way to interpret the Python demonstration?
Quick quiz
Why does Chapter 53 matter in an applied econometrics workflow?
Key takeaway
Capstones integrate question, data, model, evaluation, and communication. Benchmarks and held-out tests keep complexity honest. A portfolio artifact includes reproducibility and limitations, not only attractive charts.