Lesson 16
Obtaining Economic and Financial Data
Big question
How can a live data source be used without making the analysis disappear when the network or provider changes?
Lesson progress
Complete checkpoints as you learn
Learning objectives
- Retrieve data from authoritative APIs.
- Record series IDs, units, frequencies, and retrieval dates.
- Cache legally redistributable snapshots.
- Build graceful fallbacks and error handling.
- Prerequisites: Chapters 7, 9, and 10.
- Key terms: API, endpoint, series identifier, provenance, cache, licence.
Simple explanation
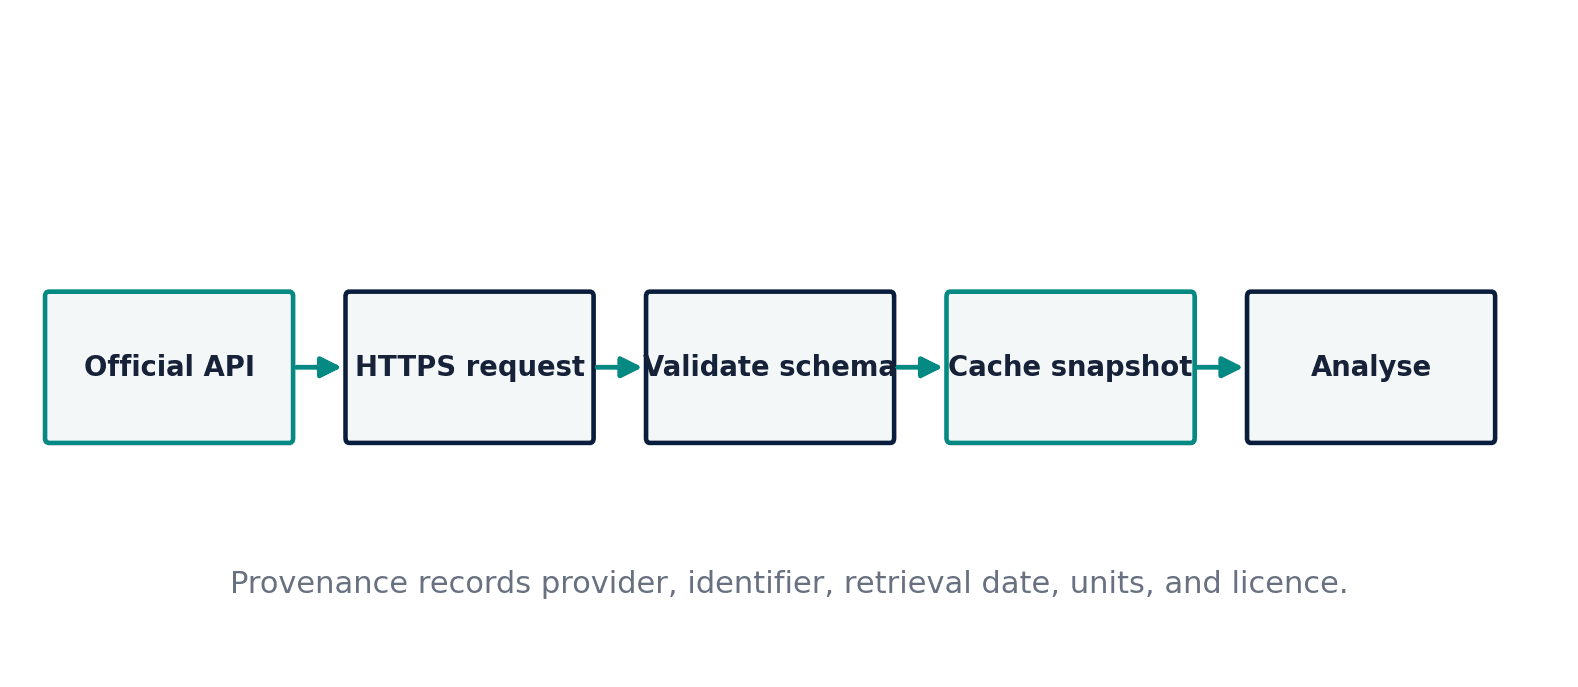
The Bank of Canada Valet API, Statistics Canada Web Data Service, FRED, and the World Bank provide documented programmatic access to economic series (Bank of Canada 2026; Statistics Canada 2026; Federal Reserve Bank of St. Louis 2026; World Bank 2026). An API request should name the series and date range, validate the response, and preserve provider metadata. Market-data interfaces require extra caution because unofficial endpoints may change and redistribution rights may differ from access rights.
Key terms
- Retrieve data from authoritative APIs
- A core idea in Chapter 16 that students apply carefully in economic analysis.
- Record series IDs, units, frequencies, and retrieval dates
- A core idea in Chapter 16 that students apply carefully in economic analysis.
- Cache legally redistributable snapshots
- A core idea in Chapter 16 that students apply carefully in economic analysis.
- Build graceful fallbacks and error handling
- A core idea in Chapter 16 that students apply carefully in economic analysis.
- Prerequisites: Chapters 7, 9, and 10
- A core idea in Chapter 16 that students apply carefully in economic analysis.
- Key terms: API, endpoint, series identifier, provenance, cache, licence
- A core idea in Chapter 16 that students apply carefully in economic analysis.
Analytical workflow
Interpret the expression in words and units before using it in a claim.
Example
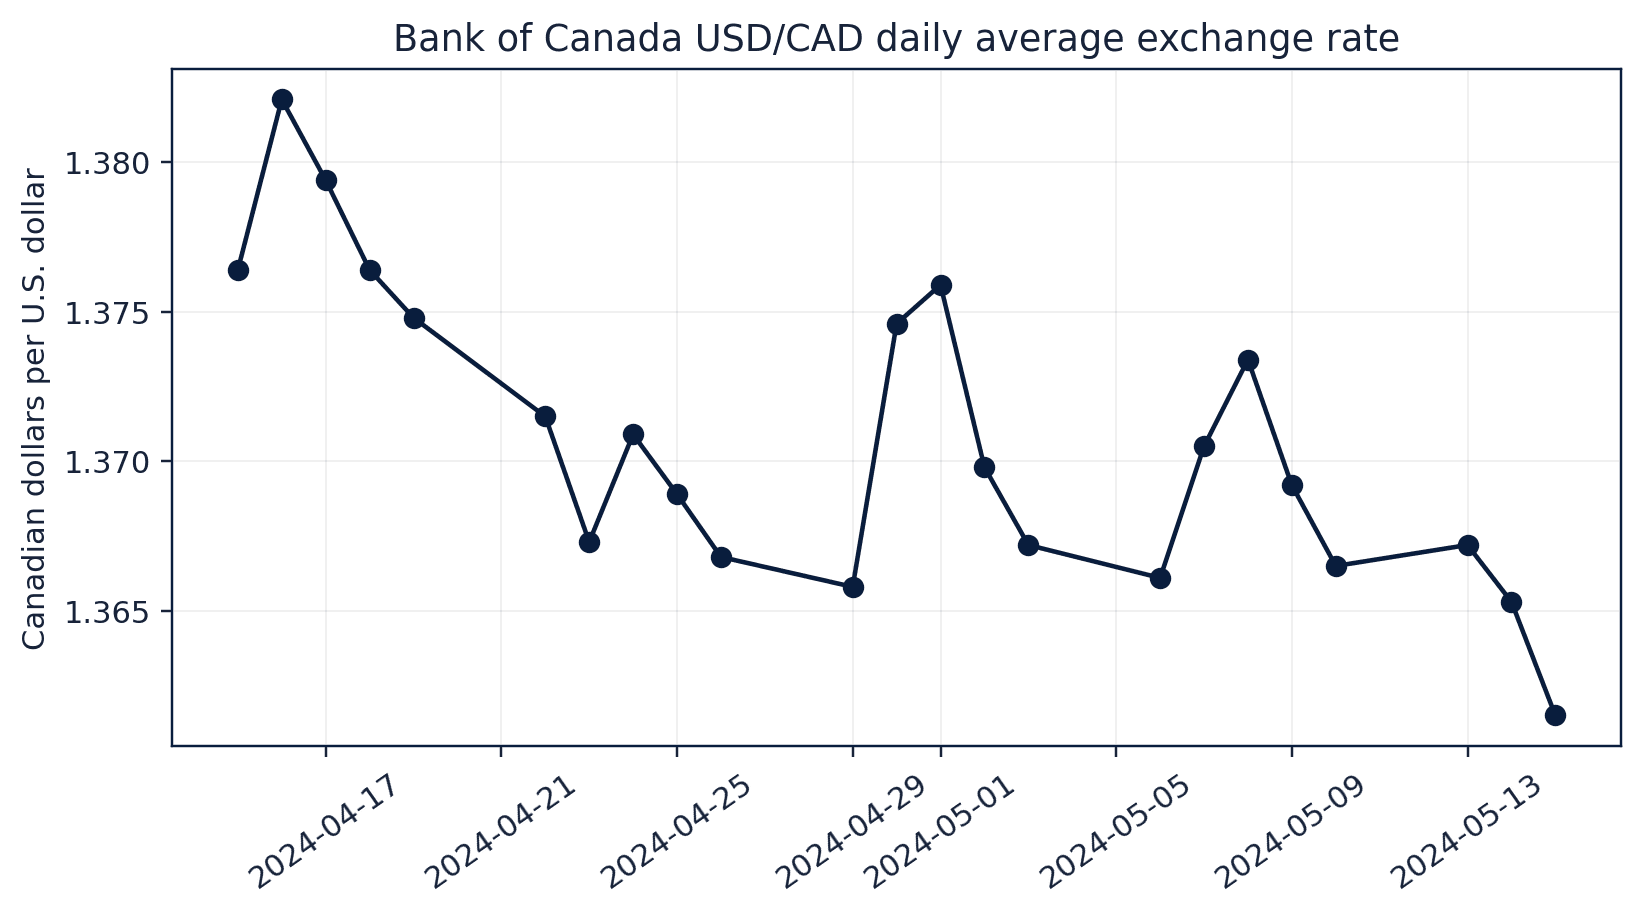
Interpretation. The frozen file makes the example independent of a live request while preserving the official series identifier.
Prerequisites
- Complete the preceding course chapters or review their summaries as needed.
Full theory and examples
16.2
Prefer authoritative providers
The Bank of Canada Valet API, Statistics Canada Web Data Service, FRED, and the World Bank provide documented programmatic access to economic series (Bank of Canada 2026; Statistics Canada 2026; Federal Reserve Bank of St. Louis 2026; World Bank 2026). An API request should name the series and date range, validate the response, and preserve provider metadata. Market-data interfaces require extra caution because unofficial endpoints may change and redistribution rights may differ from access rights.
16.3
A live call is not a reproducibility plan
A future request can return revised data, a changed schema, or an error. When licensing permits, store a frozen snapshot with its retrieval date and keep the retrieval script. When redistribution is restricted, store code and metadata rather than raw observations. Essential teaching examples should include a small deterministic fallback so that the lesson remains usable offline.
16.4
Validate response semantics
A successful HTTP status does not prove that the requested series, frequency, or units are correct. Inspect column names, date coverage, missing values, and observation counts. Economic series can be revised and may represent seasonally adjusted, annualized, index, level, or growth-rate concepts. The data dictionary belongs beside the code.
16.5
Python demonstrations
16.5.1
Demonstration 16.1: Load the frozen Bank of Canada example
Verified output
Interpretation. The frozen file makes the example independent of a live request while preserving the official series identifier.
16.5.2
Demonstration 16.2: A guarded network pattern
Verified output
Interpretation. The timeout and exception handling prevent an indefinite hang. Production code should also validate schema and use the frozen fallback.
16.6
Visual evidence
16.7
Reference table
Why This Matters
Reproducible data access links an empirical result to an identifiable provider, series, transformation, and retrieval date.
Common Mistake
Using a ticker or series code without documenting whether the values are adjusted, seasonally adjusted, annualized, or revised.
Ceteris LAB Tip
Save the raw response headers or metadata alongside the observations whenever the provider supplies them.
R-to-Python / Source Bridge
The 2013 pre-class notes used quantmod and now-obsolete Google Finance examples. This chapter replaces them with current official APIs, documented market-data cautions, and a frozen Bank of Canada example (Tsay 2013).
| Provider | Strength | Required metadata |
|---|---|---|
| Bank of Canada | Canadian rates and exchange rates | series code, units, date range |
| Statistics Canada | official Canadian tables | table/product ID and vector IDs |
| FRED | U.S. and international macro series | series ID and frequency |
| World Bank | cross-country indicators | indicator code and country coverage |
| Market-data interface | prices and volumes | provider status, adjustments, licence |
Visual evidence

Additional Python demonstrations
Live Python
Source demonstration 2
Source demonstration 2
Stdout
Run Python to see results here.
Status / stderr
Ready to run Python in your browser.
Line-by-line guide
- Line 1Create or update a Python object used in the analysis.
- Line 2Display a result so students can inspect the output.
- Line 3Display a result so students can inspect the output.
Verified source output
23 1.3708
5
Interpretation. The frozen file makes the example independent of a live request while preserving the official series identifier.
Interpretation. The timeout and exception handling prevent an indefinite hang. Production code should also validate schema and use the frozen fallback.
Guided practice
- 1Re-run Demonstration 16.1 and change one input while keeping the analytical question fixed.
- 2Explain in two sentences how the output supports, or fails to support, the chapter opening question.
- 3Add one validation check that would prevent a plausible error.
Exercises
- 1Retrieve a short official series and record metadata.
- 2Write a fallback that loads a frozen file.
- 3Validate expected date coverage.
- 4Explain the difference between access permission and redistribution permission.
Source and downloads
Chapter 16 of Fundamentals of Python for Financial Econometrics by Mohammad Safavi, Ph.D.. The lesson is an original Ceteris Lab web adaptation of the supplied publication package.
Live Python
Obtaining Economic and Financial Data: live Python
Obtaining Economic and Financial Data: live Python
Stdout
Run Python to see results here.
Status / stderr
Ready to run Python in your browser.
Line-by-line guide
- Line 1Load a Python library needed for data work or regression.
- Line 2Load a Python library needed for data work or regression.
- Line 4Create or update a Python object used in the analysis.
- Line 5Run this Python instruction as part of the lesson workflow.
- Line 6Run this Python instruction as part of the lesson workflow.
- Line 7Run this Python instruction as part of the lesson workflow.
- Line 8Run this Python instruction as part of the lesson workflow.
- Line 9Run this Python instruction as part of the lesson workflow.
- Line 10Run this Python instruction as part of the lesson workflow.
- Line 11Load the dataset into a pandas DataFrame.
- Line 12Display a result so students can inspect the output.
Python walkthrough
- 1`from io import StringIO`: Loads a package or function used by the analysis.
- 2`import pandas as pd`: Loads a package or function used by the analysis.
- 3`frozen_csv = StringIO("""date,FXUSDCAD`: Creates or updates a named object used by later steps.
- 4`2024-04-15,1.3762`: Executes the next transparent step in the workflow.
- 5`2024-04-16,1.3778`: Executes the next transparent step in the workflow.
- 6`2024-04-17,1.3731`: Executes the next transparent step in the workflow.
- 7`2024-04-18,1.3704`: Executes the next transparent step in the workflow.
- 8`2024-04-19,1.3746`: Executes the next transparent step in the workflow.
- 9`""")`: Executes the next transparent step in the workflow.
- 10`fx = pd.read_csv(frozen_csv, parse_dates=["date"])`: Loads a dataset into a pandas DataFrame for inspection and analysis.
- 11`print(fx.shape[0], round(fx["FXUSDCAD"].mean(), 4))`: Displays a result so it can be checked and interpreted.
Live notebook
Run this lesson as a notebook
Open an editable notebook cell-by-cell, run Python in the browser, and download the `.ipynb` file for later.
Related dataset
Ceteris Lab teaching sample
Estimated time
25 to 40 min
Packages
pandas, numpy
Expected output
Printed Python results that can be compared with the lesson explanation.
Learning goals
- Load and inspect Ceteris Lab teaching sample.
- Run the Python cells connected to Obtaining Economic and Financial Data.
- Interpret the output using Retrieve data from authoritative APIs and Record series IDs, units, frequencies, and retrieval dates.
Common errors
- File not found: check that wage_sample.csv is installed or use the course data folder.
- Package import error: use the browser notebook first, then download for local Jupyter if your local packages differ.
- Column name error: compare your variable names with the dataset variables listed for this notebook.
Dataset path helper
import pandas as pd

df = pd.read_csv("/data/wage_sample.csv")
df.head()
Interactive activity
Chapter 16 interactive
Data evidence planner
Which choice makes an exploratory result easier to defend?
Immediate feedback
Choose a decision, then test how the claim changes as evidence becomes stronger or weaker.
Try it yourself
Write one plain-English sentence explaining the main idea from this lesson.
Common mistakes
Check these before you move on.
Return to the lesson assumptions, units, diagnostics, and source evidence to replace this shortcut with a defensible interpretation.
Quick quiz
Which statement best answers the Chapter 16 opening question: How can a live data source be used without making the analysis disappear when the network or provider changes?
Quick quiz
Which practice should be avoided when applying Obtaining Economic and Financial Data?
Quick quiz
What is the most defensible way to interpret the Python demonstration?
Quick quiz
Why does Chapter 16 matter in an applied econometrics workflow?
Key takeaway
Authoritative APIs improve provenance. Frozen snapshots and retrieval scripts support reproducibility. Schema, units, frequency, and licensing require explicit validation.