Lesson 10
Importing, Cleaning, Validating, and Exporting Data
Big question
How can messy input be transformed without erasing the evidence of what was changed?
Lesson progress
Complete checkpoints as you learn
Learning objectives
- Read common tabular formats.
- Parse dates and numeric columns explicitly.
- Handle missing, duplicate, invalid, and extreme values.
- Write validation checks and export clean data.
- Prerequisites: Chapter 9.
- Key terms: CSV, schema, missing value, duplicate, outlier, validation.
Simple explanation
When pandas reads a file, it infers delimiters, headers, types, and missing-value markers. Inference is convenient, not infallible. A column containing one nonnumeric note may become text. A date can be interpreted as month-day or day-month. Robust workflows specify critical dtypes, parse dates intentionally, and retain the original file. Parquet is useful for preserving types and compressing data, while CSV remains portable and inspectable.
Key terms
- Read common tabular formats
- A core idea in Chapter 10 that students apply carefully in economic analysis.
- Parse dates and numeric columns explicitly
- A core idea in Chapter 10 that students apply carefully in economic analysis.
- Handle missing, duplicate, invalid, and extreme values
- A core idea in Chapter 10 that students apply carefully in economic analysis.
- Write validation checks and export clean data
- A core idea in Chapter 10 that students apply carefully in economic analysis.
- Prerequisites: Chapter 9
- A core idea in Chapter 10 that students apply carefully in economic analysis.
- Key terms: CSV, schema, missing value, duplicate, outlier, validation
- A core idea in Chapter 10 that students apply carefully in economic analysis.
Analytical workflow
Interpret the expression in words and units before using it in a claim.
Example
Interpretation. The missing-value count and duplicate flag describe separate quality concerns.
Prerequisites
- Complete the preceding course chapters or review their summaries as needed.
Full theory and examples
10.2
Import is an inference step
When pandas reads a file, it infers delimiters, headers, types, and missing-value markers. Inference is convenient, not infallible. A column containing one nonnumeric note may become text. A date can be interpreted as month-day or day-month. Robust workflows specify critical dtypes, parse dates intentionally, and retain the original file. Parquet is useful for preserving types and compressing data, while CSV remains portable and inspectable.
10.3
Cleaning is a sequence of justified decisions
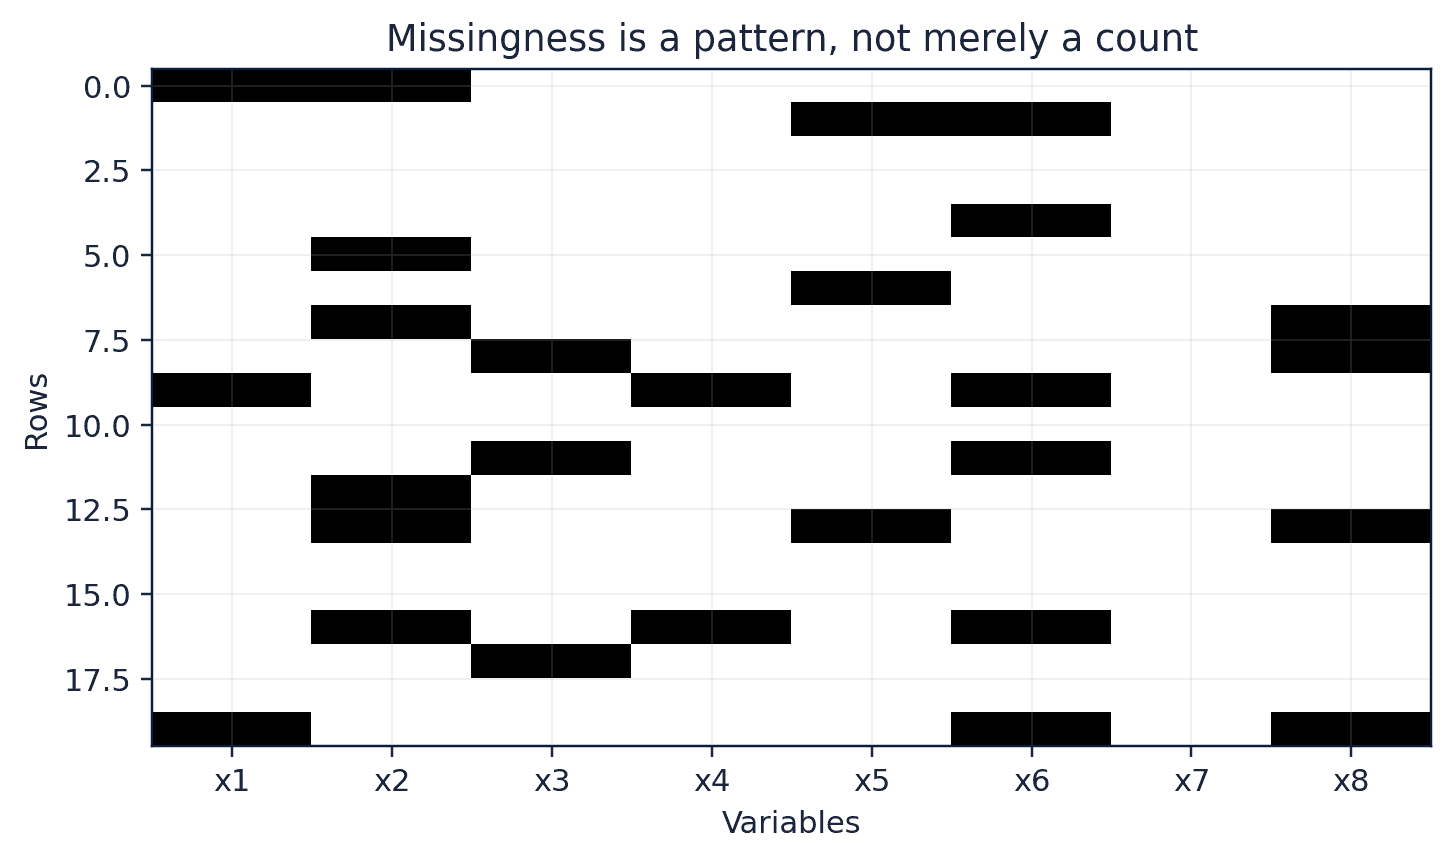
Missingness, duplicates, and outliers are different problems. A missing value may be expected because a market was closed; a duplicate may be a genuine repeated transaction; an extreme observation may be the event of greatest interest. Cleaning rules therefore require domain knowledge. Every deletion or replacement should be reproducible, counted, and described. A validation report is often more informative than a single “cleaned” file.
10.4
A schema makes assumptions executable
Validation checks can assert unique keys, allowed categories, positive prices, monotonic dates, and plausible ranges. Failing early is better than fitting a model to invalid inputs. The goal is not to force data into a preferred story, but to test whether the file satisfies the conditions required by the next analytical step.
10.5
Python demonstrations
10.5.1
Demonstration 10.1: Clean a small table
Verified output
Interpretation. The missing-value count and duplicate flag describe separate quality concerns.
10.5.2
Demonstration 10.2: Validate an economic series
Verified output
Interpretation. The range is intentionally broad for illustration. Real thresholds should reflect the variable and units.
10.6
Visual evidence
10.7
Reference table
Why This Matters
Data validation prevents errors from becoming polished charts and confident coefficients.
Common Mistake
Dropping all missing rows without asking why they are missing or how the deletion changes the sample.
Ceteris LAB Tip
Create a quality table before cleaning and another after cleaning. The difference is your audit trail.
R-to-Python / Source Bridge
Older examples loaded text files with implicit assumptions. This chapter replaces them with explicit schemas, validation, and an audit trail.
| Issue | Diagnostic | Possible response |
|---|---|---|
| Missing value | isna().sum() | investigate mechanism; impute only with justification |
| Duplicate key | duplicated(keys) | resolve or aggregate with documented rule |
| Invalid range | between(low, high) | correct source or reject row |
| Wrong dtype | dtypes / to_numeric | parse with explicit error handling |
| Outlier | robust summaries and plots | retain, flag, winsorize only with rationale |
Visual evidence
Additional Python demonstrations
Live Python
Source demonstration 2
Source demonstration 2
Stdout
Run Python to see results here.
Status / stderr
Ready to run Python in your browser.
Line-by-line guide
- Line 1Run this Python instruction as part of the lesson workflow.
- Line 2Run this Python instruction as part of the lesson workflow.
- Line 3Run this Python instruction as part of the lesson workflow.
- Line 4Keep rows that have the variables required for this model.
- Line 5Run this Python instruction as part of the lesson workflow.
- Line 7Display a result so students can inspect the output.
Verified source output
{'date': 0, 'value': 1, 'is_duplicate_date': 0} 2True
{'date': 0, 'value': 1, 'is_duplicate_date': 0}
2Interpretation. The missing-value count and duplicate flag describe separate quality concerns.
Interpretation. The range is intentionally broad for illustration. Real thresholds should reflect the variable and units.
Guided practice
- 1Re-run Demonstration 10.1 and change one input while keeping the analytical question fixed.
- 2Explain in two sentences how the output supports, or fails to support, the chapter opening question.
- 3Add one validation check that would prevent a plausible error.
Exercises
- 1Import a CSV with explicit date parsing.
- 2Count missing values by column.
- 3Check uniqueness of a composite key.
- 4Export a processed table and a metadata file.
Source and downloads
Chapter 10 of Fundamentals of Python for Financial Econometrics by Mohammad Safavi, Ph.D.. The lesson is an original Ceteris Lab web adaptation of the supplied publication package.
Live Python
Importing, Cleaning, Validating, and Exporting Data: live Python
Importing, Cleaning, Validating, and Exporting Data: live Python
Stdout
Run Python to see results here.
Status / stderr
Ready to run Python in your browser.
Line-by-line guide
- Line 1Load a Python library needed for data work or regression.
- Line 2Load a Python library needed for data work or regression.
- Line 4Create or update a Python object used in the analysis.
- Line 5Load the dataset into a pandas DataFrame.
- Line 6Create or update a Python object used in the analysis.
- Line 7Display a result so students can inspect the output.
- Line 8Display a result so students can inspect the output.
Python walkthrough
- 1`import pandas as pd`: Loads a package or function used by the analysis.
- 2`from io import StringIO`: Loads a package or function used by the analysis.
- 3`raw = StringIO("date,value\n2026-01-01,2.1\n2026-02-01,NA\n2026-02-01,2.4")`: Creates or updates a named object used by later steps.
- 4`df = pd.read_csv(raw, parse_dates=["date"], na_values=["NA"])`: Loads a dataset into a pandas DataFrame for inspection and analysis.
- 5`df["is_duplicate_date"] = df.duplicated("date", keep=False)`: Creates or updates a named object used by later steps.
- 6`print(df.isna().sum().to_dict())`: Displays a result so it can be checked and interpreted.
- 7`print(df["is_duplicate_date"].sum())`: Displays a result so it can be checked and interpreted.
Live notebook
Run this lesson as a notebook
Open an editable notebook cell-by-cell, run Python in the browser, and download the `.ipynb` file for later.
Related dataset
Ceteris Lab teaching sample
Estimated time
25 to 40 min
Packages
pandas, numpy
Expected output
Printed Python results that can be compared with the lesson explanation.
Learning goals
- Load and inspect Ceteris Lab teaching sample.
- Run the Python cells connected to Importing, Cleaning, Validating, and Exporting Data.
- Interpret the output using Read common tabular formats and Parse dates and numeric columns explicitly.
Common errors
- File not found: check that wage_sample.csv is installed or use the course data folder.
- Package import error: use the browser notebook first, then download for local Jupyter if your local packages differ.
- Column name error: compare your variable names with the dataset variables listed for this notebook.
Dataset path helper
import pandas as pd

df = pd.read_csv("/data/wage_sample.csv")
df.head()
Interactive activity
Chapter 10 interactive
Data evidence planner
Which choice makes an exploratory result easier to defend?
Immediate feedback
Choose a decision, then test how the claim changes as evidence becomes stronger or weaker.
Try it yourself
Write one plain-English sentence explaining the main idea from this lesson.
Common mistakes
Check these before you move on.
Return to the lesson assumptions, units, diagnostics, and source evidence to replace this shortcut with a defensible interpretation.
Quick quiz
Which statement best answers the Chapter 10 opening question: How can messy input be transformed without erasing the evidence of what was changed?
Quick quiz
Which practice should be avoided when applying Importing, Cleaning, Validating, and Exporting Data?
Quick quiz
What is the most defensible way to interpret the Python demonstration?
Quick quiz
Why does Chapter 10 matter in an applied econometrics workflow?
Key takeaway
Import decisions affect types and missingness. Cleaning rules require substantive justification. Validation turns assumptions into checks.